Data Study
US Residential Solar Payback Period by State, 2026: Every State Ranked After the 30% Tax Credit Ended
Key points
- Hawaii pays back fastest at 4.4 years; North Dakota slowest at 20.2 years — a ~4.6× spread driven mostly by electricity rates, not sunshine.
- The median state payback is 15.6 years for an 8 kW system at $3.60/W with no federal credit — up from roughly 8–10 years when the 30% credit applied.
- Only 6 states offer upfront incentives that reduce system cost in 2026; New York’s 25% credit (up to $5,000) and South Carolina’s 25% credit move the needle most.
- Electricity price matters more than sunshine: cloudy Massachusetts (9.0 years) beats sunny Arizona (13.2 years) because its power costs twice as much.
- Full 50-state data table and downloadable CSV below; methodology and limitations documented in full.
What is “simple payback period”?
The simple payback period is the number of years it takes for a solar system’s electricity-bill savings to equal its net installed cost. Formula: net system cost ÷ annual bill savings. It ignores financing costs, panel degradation, and future rate changes — which is why we also publish sensitivity scenarios below. It is the single most-quoted number in residential solar sales, and the one most distorted by the end of the federal tax credit.
Why it matters
On December 31, 2025, the 30% federal residential solar tax credit — Section 25D of the tax code — expired for homeowner-owned systems, a casualty of the “One Big Beautiful Bill.” For a typical $28,800 installation, that was $8,640 vanishing overnight. Overnight, the central math of American rooftop solar changed, and almost no public ranking has caught up. This study is that update: a 50-state, apples-to-apples payback ranking built for the post-credit era.
The stakes are not abstract. The EnergySage marketplace reported median quoted residential prices at a record-low $2.48/W in early 2025, and 92% of installers surveyed said losing the 30% credit would harm their business. Whether rooftop solar still makes financial sense in 2026 is now almost entirely a state-level question — answered by your utility rate, your sun, and whatever your state government still offers.
The data, in brief: we modeled an 8 kW rooftop system at the national median installed price of $3.60/W ($28,800 gross, per Berkeley Lab’s Tracking the Sun 2025), applied each state’s July 2026 residential electricity rate from the EIA’s Table 5.6.A, estimated annual production from NREL’s Annual Technology Baseline capacity factors, and subtracted the six states’ verifiable upfront incentives. The result: paybacks from 4.4 to 20.2 years, median 15.6.
The headline ranking
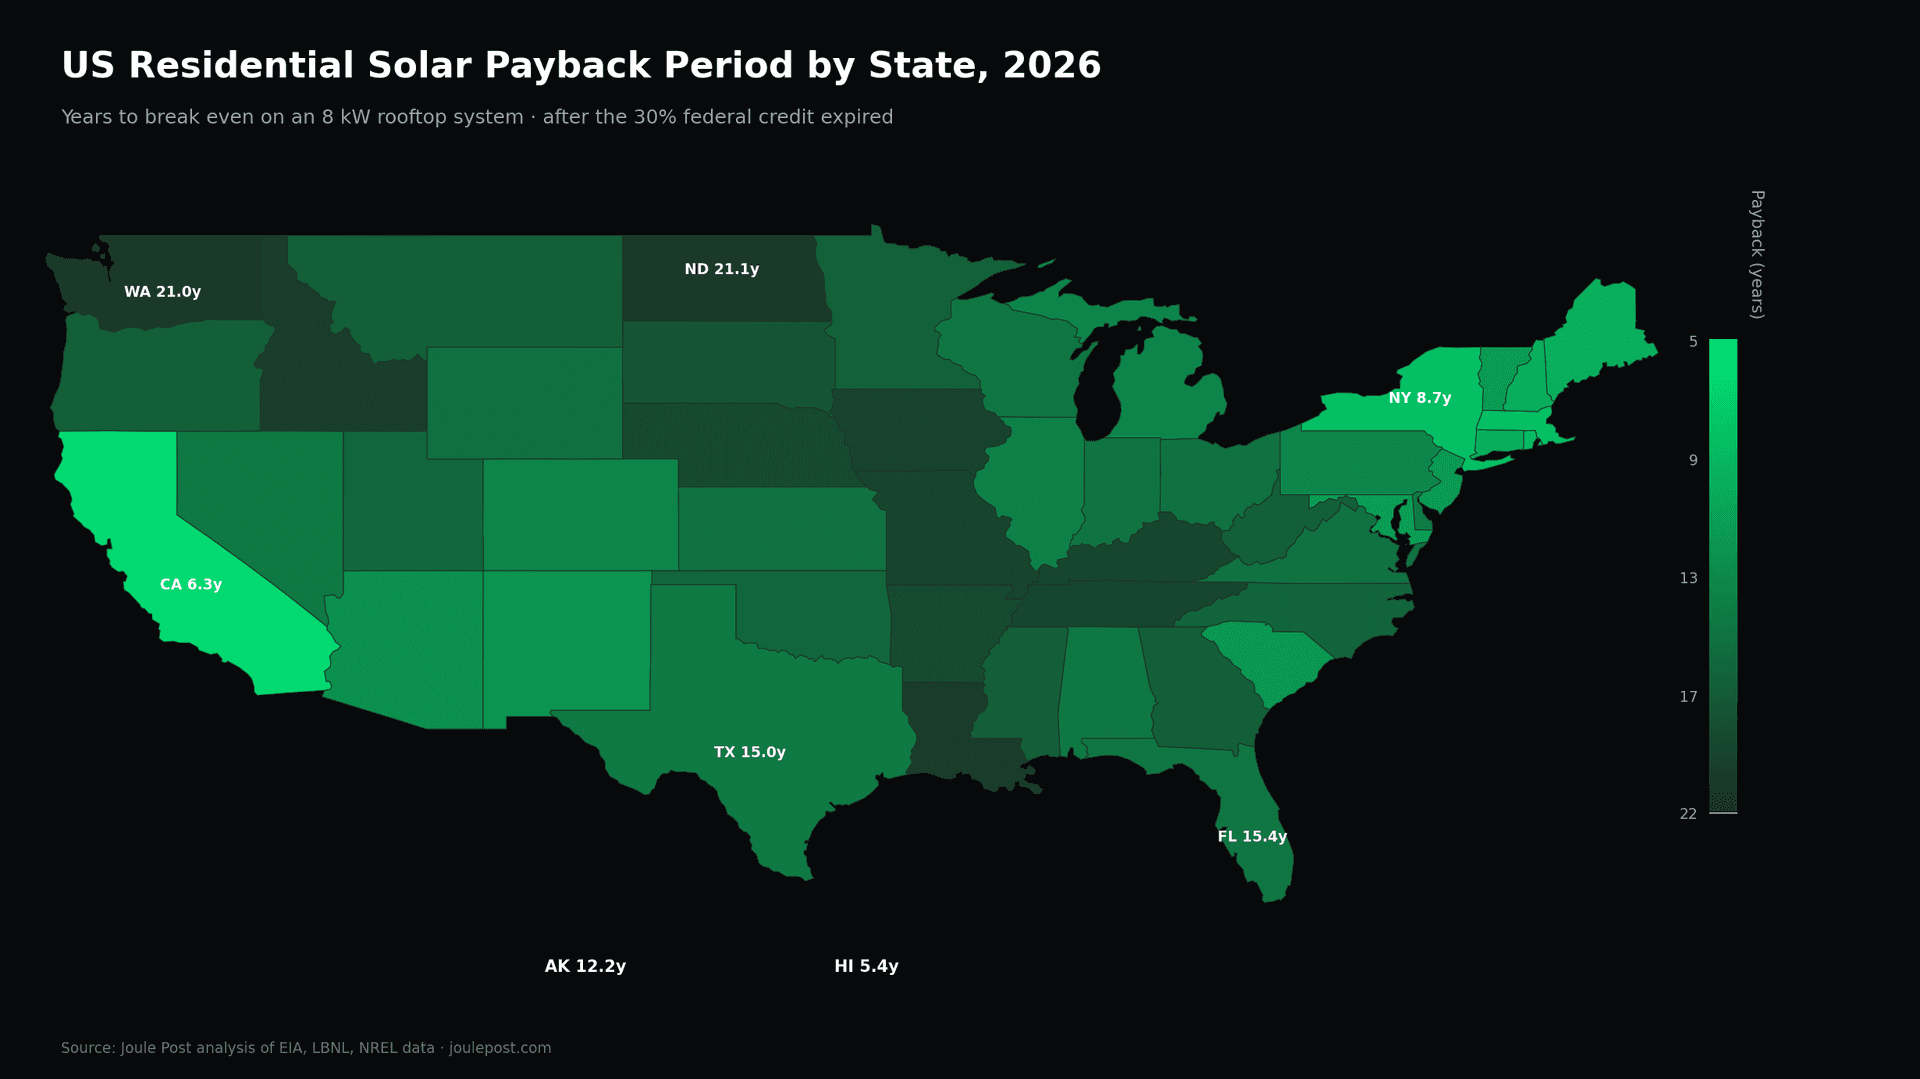
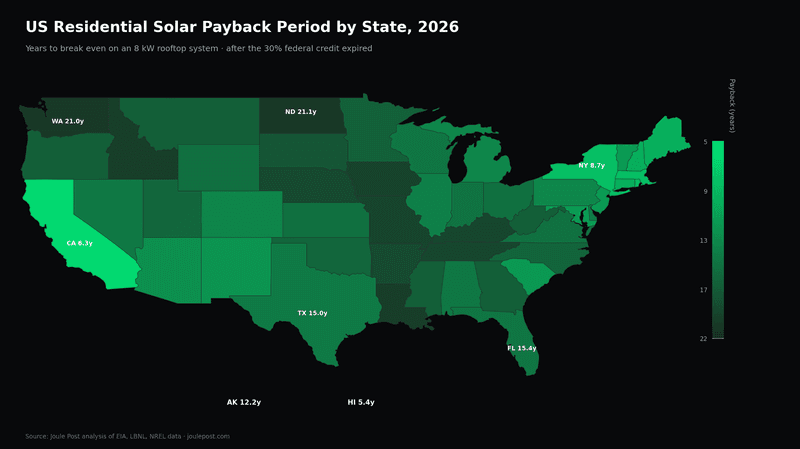
Hawaii (4.4 years) and California (6.3 years) remain in a league of their own. Hawaii pairs the nation’s highest residential rate — 48.00¢/kWh, up about 22% from a year earlier and the steepest increase in the nation — with excellent sun, so an 8 kW system there offsets roughly $6,492 a year. California’s 33.61¢ rate does similar work. These are the only two states under 7 years.
The next tier is New England, and this is where the study gets interesting. New York (7.8), Massachusetts (9.0), Maine (9.1), Rhode Island (10.0), New Hampshire (10.7), and Connecticut (11.7) all land in the top 10 — despite some of the weakest solar resource in the country. New York gets a genuine boost from its 25% state tax credit (up to $5,000), which cuts the modeled net cost to $23,800, the lowest of any state. Massachusetts benefits from both a 30.49¢ rate and its $1,000 state credit.
At the other end, North Dakota (20.2 years), Louisiana (20.1), Washington (20.1), Kentucky (19.6), and Tennessee (18.8) form the bottom five. Cheap power is the common thread: Louisiana’s 12.72¢ and Idaho’s 13.73¢ are among the lowest rates in the nation, so even decent sun can’t generate enough dollar savings. Washington is the instructive outlier — a 14.71¢ rate combined with the Northwest’s weak winter sun (13.9% capacity factor) produces the second-worst payback despite the state’s green reputation.
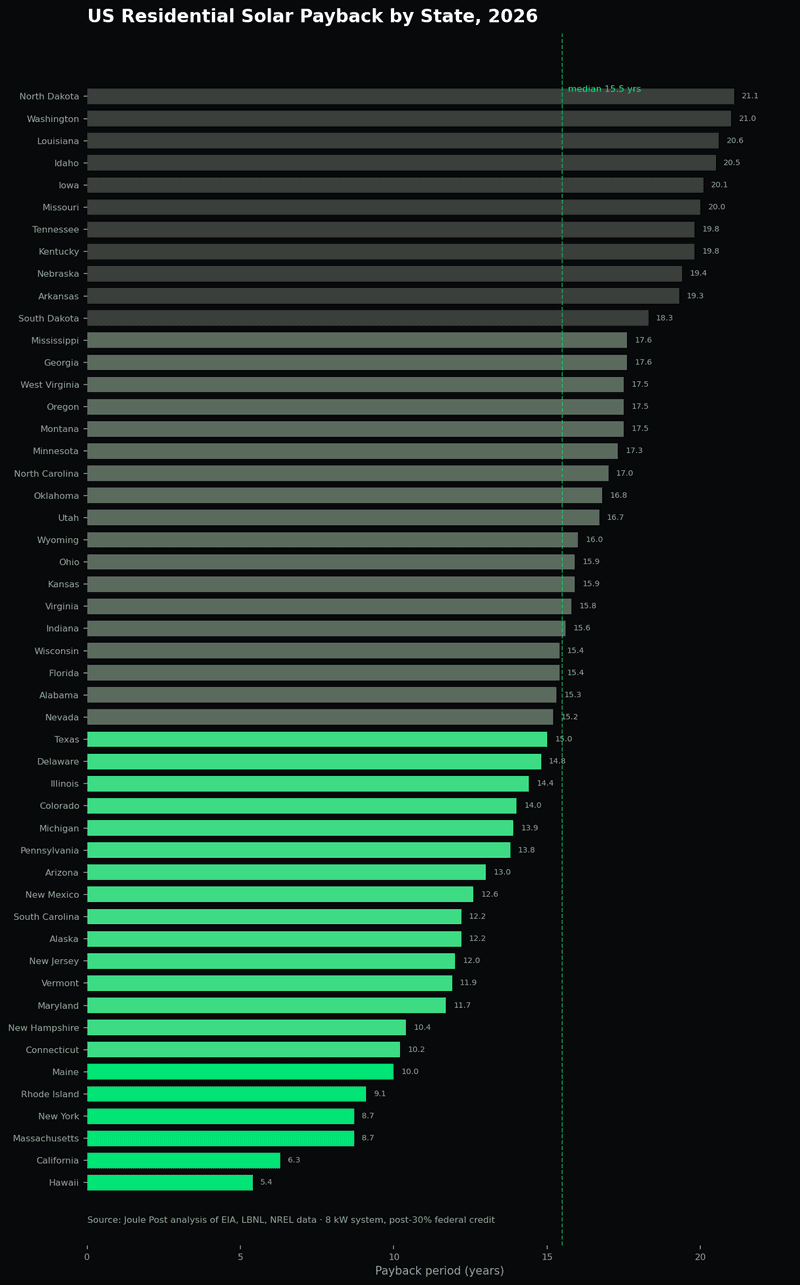
The national picture: 11 states pay back in under 12 years; 8 states take 18+ years. For context, most solar panels carry 25-year performance warranties — a 20-year payback leaves almost no margin for the unexpected.
Sunshine is overrated; your utility bill is everything
The most counterintuitive finding is how little sunshine matters relative to rates. Compare:
- Massachusetts vs. Arizona: Arizona gets ~40% more sun per installed watt (19.6% vs. 14.5% capacity factor), yet Massachusetts pays back in 9.0 years versus Arizona’s 13.2 — because Bay Staters pay 30.49¢/kWh against Arizona’s 15.38¢.
- Nevada vs. New Jersey: Nevada has the best sun in the continental US (19.6% CF) but a 12.77¢ rate → 16.4-year payback. New Jersey’s mediocre sun (15.2% CF) at 25.19¢ → 10.7 years.
- Texas vs. Pennsylvania: Texas sunshine (17.0% CF) loses to Pennsylvania gloom (14.5% CF): 15.2 vs. 13.0 years, on rates of 15.88¢ vs. 21.72¢.
This isn’t a quirk of our model — it’s arithmetic. Annual savings = production × rate, and rates vary 3.8× across states (12.72¢ to 48.00¢) while solar resource varies only ~1.5× (12.7% to 19.6% capacity factor). As one analyst noted of EIA data, a Hawaii household pays roughly 3.5× the Idaho rate “for the identical kilowatt-hour.” That identical kilowatt-hour is worth 3.5× more when a solar panel makes it.
The policy implication is sharp: the end of the federal credit punishes cheap-power states most. When the 30% credit existed, it shaved ~30% off every state’s payback regardless of rates. Now, high-rate states still clear the bar on rates alone, while low-rate states lost their main equalizer.
The six states still cutting checks
With the federal credit gone, state incentives are the only upfront cost relief left — and only six states offer anything that directly reduces installed cost in 2026:
- New York: 25% state income-tax credit, capped at $5,000 — the most valuable in the country on a percentage basis, cutting our model’s net cost to $23,800. It stacks with the NY-Sun rebate program (applications open through 2030).
- South Carolina: 25% state credit with a $3,500/year claim cap and 10-year carryforward — effectively the full $7,200 on our modeled system, just claimed over time (2026 guide). This single incentive lifts South Carolina to 12.4 years, 14th nationally, despite a middling 15.47¢ rate.
- New Mexico: 10% Solar Market Development Tax Credit, up to $6,000 — worth $2,880 on our system (DSIRE record).
- Arizona, Massachusetts, Maryland: $1,000 each, via state tax credits or (Maryland) a direct grant (program roundup).
Correction: Montana’s $1,000 Alternative Energy credit — listed in the October 9 edition of this study — was repealed in 2021. It is no longer modeled here.
Notable absences: California, Texas, and Florida — the three largest solar markets — offer no state income-tax credit. California leans entirely on its 33.61¢ rates; Texas leans on utility rebates (AEP’s up to $6,000, Austin Energy’s $2,500) that vary by territory and aren’t statewide (2026 incentive survey). Iowa’s credit was defined as 50% of the federal credit (about 15% effective when the federal credit was 30%) — with the federal credit at $0, Iowa’s is effectively $0 too.
We deliberately excluded production-based incentives (Massachusetts’ SMART program at ~$0.03/kWh for 20 years; Rhode Island’s Renewable Energy Growth at ~$0.27/kWh) and SREC markets from the upfront cost — they pay out over time and would only improve the ranked paybacks shown. Our numbers are conservative for MA, RI, NJ, and PA.
Regional scorecard
- New England (avg 10.5 yrs): The surprise champion region. Brutal rates (24–32¢) more than compensate for weak sun. Every New England state beats the national median.
- Pacific (avg ~12.1 yrs, ex-Alaska): Hawaii and California carry the region; Oregon (17.7) and Washington (20.1) show what happens when Northwestern rates meet Northwestern clouds.
- Mid-Atlantic (avg ~11.7 yrs): Solid across the board — NY’s credit and MD’s grant help; PA/NJ ride high rates.
- Mountain West (avg 15.6 yrs): The paradox region: the best sun in America (AZ, NM, NV, UT, CO all ≥18% CF) neutralized by some of the cheapest power (NV 12.77¢, UT 13.12¢, NM 16.09¢).
- South Atlantic & South Central (avg ~16.4 yrs): Cheap power dominates; South Carolina’s credit is the region’s lone bright spot.
- West North Central (avg ~17.2 yrs): The toughest region — North Dakota (20.2) and Nebraska (18.5) still exceed 18 years on some of America’s lowest rates, though Missouri and Iowa improved sharply on higher July rates.
Methodology
Full methodology is documented in methodology.md; the essentials:
- System: 8 kW DC rooftop at $3.60/W = $28,800 gross — the 2025 national median for host-owned residential systems from Berkeley Lab’s Tracking the Sun. (EnergySage’s quoted-price median was lower at $2.48/W, but quoted prices run below installed medians; we used the installed figure.)
- Federal credit: $0 — Section 25D expired 12/31/2025 (ConsumerAffairs 2026 guide; confirmed at $0 for post-2025 installs).
- Rates: EIA Table 5.6.A, July 2026 residential, by state (EIA Electric Power Monthly).
- Production: 8 kW × 8,760 hours × state capacity factor, with capacity factors (12.7%–19.6%) assigned from NREL’s Annual Technology Baseline 2024 resource classes by approximate state-average solar resource. Marked as estimated — see limitations.
- State incentives: the six programs listed above, verified against 2026-dated sources (Story of Solar, WPR, Navigating Solar cheat sheet).
- Payback: (gross − state incentive) ÷ (annual kWh × rate). Simple, undiscounted.
Limitations — read before quoting
- 100% retail-rate offset assumed. Real households directly self-consume ~60–80% of production; the rest is exported under net metering, increasingly credited below retail. Our sensitivity test (70% self-consumption, exports at half retail) stretches the median payback to ~18.4 years.
- Rates frozen at July 2026. EIA data shows residential rates rising ~5%/year nationally (EC Mag; June 2026 update). A 3%/yr escalation scenario shortens the median to ~13.0 years.
- Cash purchase; no degradation, O&M, or inverter replacement. Loan-financed systems (median $4.50/W per LBNL) push the median past 19.5 years.
- Capacity factors are estimated via state-to-NREL-class mapping; individual rooftops vary ±20%.
- One rate per state. EIA state averages blend utilities — your utility’s rate is what matters.
- July rates run seasonally high. The July 2026 U.S. average residential rate was 18.31¢, above the annual average — so modeled paybacks may run slightly shorter than a full-year average would give.
- Connecticut’s rate cut is temporary. Connecticut’s 24.16¢ reflects PURA’s May 2026 interim rate decision cutting ~4.3–4.9¢/kWh from bills through April 2027; if the cut is not extended, Connecticut’s payback would lengthen again.
- Lease/PPA excluded. Third-party-owned systems can still use the 48E commercial credit — a separate market with different math.
Frequently asked questions
Is residential solar still worth it in 2026 without the federal tax credit?
It depends entirely on your state. In Hawaii (4.4-year payback) and California (6.3 years), the math remains compelling on high electricity rates alone. In 8 states with paybacks over 18 years — including North Dakota, Washington, and Louisiana — a cash-purchased system is a marginal investment unless rates rise sharply or the household adds a battery to shift more consumption. The 30% credit’s expiration hurt cheap-power states most, since it was their main equalizer.
Which state has the fastest solar payback in 2026?
Hawaii, at 4.4 years for an 8 kW system — driven by the nation’s highest residential rate (48.00¢/kWh per EIA, up about 22% from a year earlier) combined with strong year-round sun. California is second at 6.3 years. No other state breaks 7 years.
Why does cloudy Massachusetts beat sunny Arizona for solar payback?
Because payback = cost ÷ (production × rate), and rates vary far more than sunshine. Massachusetts pays 30.49¢/kWh versus Arizona’s 15.38¢ — roughly double — while Arizona’s sun advantage is only ~35% more production per watt. The rate gap dominates: Massachusetts pays back in 9.0 years, Arizona in 13.2. Across all states, electricity price explains payback far better than solar resource does.
Which states still offer solar tax credits in 2026?
Six states offer upfront cost reductions we could verify for 2026: New York (25% up to $5,000), South Carolina (25%, effectively ~$7,200 via carryforward), New Mexico (10% up to $6,000), Arizona ($1,000), Massachusetts (15% up to $1,000), and Maryland ($1,000 grant). Montana’s former $1,000 household credit was repealed in 2021. Several other states offer production payments, SRECs, or utility rebates that help over time but don’t reduce day-one cost.
How accurate is this 50-state ranking?
The ranking is rate-driven and rates come from official EIA data, so the ordering is robust — but treat individual payback figures as estimates, not quotes. Capacity factors are state averages (your roof varies ±20%), rates are state averages (your utility varies), and we assume every generated kWh offsets the full retail rate. Real-world paybacks run longer where net metering is weak and shorter where rates keep rising ~5%/year. See the Limitations section for sensitivity scenarios.
Calculate your payback
Model: (system kW × $/W − state incentive) ÷ (system kW × 8,760 × capacity factor × retail rate).
Uses EIA July 2026 residential rates, NREL capacity factors, no federal credit. Estimate only — your roof, rate plan, and net metering terms will differ.
The full 50-state table
Click any column header to sort. Use the search box to filter states.
| Rank ▼ | State | Payback (yrs) | Rate (¢/kWh) | Annual kWh | Annual savings | State incentive | Net cost |
|---|---|---|---|---|---|---|---|
| 1 | Hawaii | 4.4 | 48.00 | 13,525 | $6,492 | — | $28,800 |
| 2 | California | 6.3 | 33.61 | 13,525 | $4,546 | — | $28,800 |
| 3 | New York | 7.8 | 29.90 | 10,162 | $3,038 | $5,000 | $23,800 |
| 4 | Massachusetts | 9.0 | 30.49 | 10,162 | $3,098 | $1,000 | $27,800 |
| 5 | Maine | 9.1 | 32.41 | 9,741 | $3,157 | — | $28,800 |
| 6 | Rhode Island | 10.0 | 28.29 | 10,162 | $2,875 | — | $28,800 |
| 7 | New Hampshire | 10.7 | 26.60 | 10,162 | $2,703 | — | $28,800 |
| 8 | New Jersey | 10.7 | 25.19 | 10,652 | $2,683 | — | $28,800 |
| 9 | Alaska | 11.2 | 28.83 | 8,900 | $2,566 | — | $28,800 |
| 10 | Connecticut | 11.7 | 24.16 | 10,162 | $2,455 | — | $28,800 |
| 11 | New Mexico | 11.7 | 16.09 | 13,736 | $2,210 | $2,880 | $25,920 |
| 12 | Maryland | 12.2 | 21.41 | 10,652 | $2,281 | $1,000 | $27,800 |
| 13 | Michigan | 12.3 | 23.05 | 10,162 | $2,342 | — | $28,800 |
| 14 | South Carolina | 12.4 | 15.47 | 11,283 | $1,745 | $7,200 | $21,600 |
| 15 | Vermont | 12.5 | 23.75 | 9,741 | $2,313 | — | $28,800 |
| 16 | Pennsylvania | 13.0 | 21.72 | 10,162 | $2,207 | — | $28,800 |
| 17 | Arizona | 13.2 | 15.38 | 13,736 | $2,113 | $1,000 | $27,800 |
| 18 | Colorado | 13.4 | 17.00 | 12,614 | $2,144 | — | $28,800 |
| 19 | Illinois | 14.1 | 19.22 | 10,652 | $2,047 | — | $28,800 |
| 20 | Ohio | 14.6 | 19.45 | 10,162 | $1,977 | — | $28,800 |
| 21 | Delaware | 14.6 | 18.48 | 10,652 | $1,968 | — | $28,800 |
| 22 | Virginia | 14.7 | 17.55 | 11,143 | $1,956 | — | $28,800 |
| 23 | Wisconsin | 14.9 | 19.06 | 10,162 | $1,937 | — | $28,800 |
| 24 | Texas | 15.2 | 15.88 | 11,914 | $1,892 | — | $28,800 |
| 25 | Alabama | 15.6 | 16.40 | 11,283 | $1,850 | — | $28,800 |
| 26 | Georgia | 15.7 | 16.27 | 11,283 | $1,836 | — | $28,800 |
| 27 | Kansas | 15.8 | 15.27 | 11,914 | $1,819 | — | $28,800 |
| 28 | Missouri | 16.1 | 16.09 | 11,143 | $1,793 | — | $28,800 |
| 29 | Florida | 16.1 | 15.03 | 11,914 | $1,791 | — | $28,800 |
| 30 | Minnesota | 16.2 | 17.45 | 10,162 | $1,773 | — | $28,800 |
| 31 | Indiana | 16.2 | 16.73 | 10,652 | $1,782 | — | $28,800 |
| 32 | Nevada | 16.4 | 12.77 | 13,736 | $1,754 | — | $28,800 |
| 33 | South Dakota | 16.8 | 15.37 | 11,143 | $1,713 | — | $28,800 |
| 34 | North Carolina | 16.8 | 15.16 | 11,283 | $1,711 | — | $28,800 |
| 35 | Wyoming | 16.8 | 14.36 | 11,914 | $1,711 | — | $28,800 |
| 36 | Oklahoma | 16.8 | 14.35 | 11,914 | $1,710 | — | $28,800 |
| 37 | Iowa | 16.9 | 15.99 | 10,652 | $1,703 | — | $28,800 |
| 38 | Montana | 17.2 | 14.99 | 11,143 | $1,670 | — | $28,800 |
| 39 | Utah | 17.4 | 13.12 | 12,614 | $1,655 | — | $28,800 |
| 40 | Mississippi | 17.6 | 14.54 | 11,283 | $1,641 | — | $28,800 |
| 41 | Oregon | 17.7 | 15.97 | 10,162 | $1,623 | — | $28,800 |
| 42 | Arkansas | 17.8 | 14.33 | 11,283 | $1,617 | — | $28,800 |
| 43 | West Virginia | 18.0 | 15.78 | 10,162 | $1,604 | — | $28,800 |
| 44 | Nebraska | 18.5 | 13.78 | 11,283 | $1,555 | — | $28,800 |
| 45 | Idaho | 18.6 | 13.73 | 11,283 | $1,549 | — | $28,800 |
| 46 | Tennessee | 18.8 | 13.71 | 11,143 | $1,528 | — | $28,800 |
| 47 | Kentucky | 19.6 | 13.81 | 10,652 | $1,471 | — | $28,800 |
| 48 | Washington | 20.1 | 14.71 | 9,741 | $1,433 | — | $28,800 |
| 49 | Louisiana | 20.1 | 12.72 | 11,283 | $1,435 | — | $28,800 |
| 50 | North Dakota | 20.2 | 13.41 | 10,652 | $1,428 | — | $28,800 |
Data & reuse
The complete 50-state table is below and downloadable as CSV. Journalists and researchers are welcome to cite this study with attribution to Joule Post and a link to this page. Underlying inputs: EIA Electric Power Monthly Table 5.6.A (July 2026), LBNL Tracking the Sun 2025, NREL Annual Technology Baseline 2024, DSIRE-indexed state programs.
Full Methodology
Methodology: US Residential Solar Payback Period by State, 2026
Study: Joule Post Data PR — “US Residential Solar Payback Period by State, 2026”
Author: Daniel Mercer
Date: October 12, 2026
Model version: 2.0
Purpose
Estimate the simple payback period for a typical residential rooftop solar system in each US state under 2026 conditions — i.e., after the expiration of the 30% federal residential solar tax credit (Section 25D) on December 31, 2025.
Model specification
| Parameter | Value | Source |
|---|---|---|
| System size | 8 kW DC, rooftop, south-facing | Standard residential benchmark |
| Gross installed cost | $3.60/W → $28,800 | LBNL “Tracking the Sun” 2025: median installed price of host-owned residential systems, $3.60/W (mercomindia.com summary of LBNL data) |
| Federal incentive | $0 | Section 25D 30% credit expired Dec 31, 2025 (ConsumerAffairs; pv-magazine/EnergySage) |
| Residential electricity rate | EIA Table 5.6.A, July 2026, ¢/kWh | U.S. Energy Information Administration, Electric Power Monthly |
| Annual production | 8 kW × 8,760 h × state capacity factor | NREL Annual Technology Baseline 2024, residential PV resource classes |
| State capacity factor | 12.7%–19.6% by state | Estimated — see estimation method below |
| State upfront incentives | 6 states (see table) | DSIRE-indexed programs, verified current for 2026 via multiple secondary sources |
| Annual savings | Annual kWh × retail rate | Assumes 100% of production offsets retail-rate consumption |
| Payback | Net cost ÷ annual savings | Simple (undiscounted) payback |
State incentive values used (2026)
| State | Incentive | Value on $28,800 system | Verification |
|---|---|---|---|
| New York | 25% state income-tax credit, cap $5,000 | $5,000 | sousvideguy.com (NYSERDA NY-Sun), storyofsolar.com |
| South Carolina | 25% state income-tax credit; $3,500/yr claim cap, 10-yr carryforward | $7,200 (full value counted; timing via carryforward noted) | sugarhollowsolar.com (2026 guide) |
| New Mexico | 10% Solar Market Development Tax Credit, cap $6,000 | $2,880 | cleanenergyauthority.com (DSIRE record) |
| Arizona | $1,000 state income-tax credit | $1,000 | AZ Dept. of Revenue (longstanding; craftstrom.com) |
| Massachusetts | 15% state income-tax credit, cap $1,000 | $1,000 | consumeraffairs.com, mysolarfy.com |
| Maryland | $1,000 Residential Clean Energy Grant | $1,000 | craftstrom.com (DSIRE record) |
| All other states | — | $0 | No verifiable upfront cost-reduction program found |
Programs deliberately excluded from the cost model (noted as limitations):
- Production-based incentives (MA SMART ~$0.03/kWh/20yr; RI Renewable Energy Growth ~$0.27/kWh) — real value, but paid over time, not upfront; excluding them is conservative for MA/RI payback.
- SREC markets (NJ, PA, MD, OH) — volatile, annual income, not upfront cost reduction.
- Utility rebates (TX AEP, NC Duke PowerPair, OR Energy Trust) — vary by utility territory, not statewide.
- Sales/property tax exemptions — reduce lifetime cost, not modeled in simple payback.
- Net metering terms — affect savings realization, modeled separately as a sensitivity.
Capacity factor estimation method
NREL’s Annual Technology Baseline (2024) publishes population-weighted residential PV capacity factors for 10 resource classes binned by mean global horizontal irradiance (GHI): 19.6% (class 1, GHI >5.75) down to 12.7% (class 10, GHI <3.75), US mean 15.7%.
Each state was assigned a resource class based on its approximate population-weighted average GHI from NREL solar resource geography:
- Class 1 (19.6%): AZ, NM, NV
- Class 2 (19.3%): CA, HI
- Class 3 (18.0%): CO, UT
- Class 4 (17.0%): FL, KS, OK, TX, WY
- Class 5 (16.1%): AL, AR, GA, ID, LA, MS, NC, NE, SC
- Class 6 (15.9%): MO, MT, SD, TN, VA
- Class 7 (15.2%): DE, IA, IL, IN, KY, MD, ND, NJ
- Class 8 (14.5%): CT, MA, MI, MN, NH, NY, OH, OR, PA, RI, WI, WV
- Class 9 (13.9%): ME, VT, WA
- Class 10 (12.7%): AK
Confidence: Medium. State-average GHI assignments are approximate; actual rooftop production varies ±20% with roof orientation, tilt, shading, and local weather. Rankings are driven primarily by electricity rates (3.8× spread) rather than capacity factor (1.5× spread), so class-assignment error rarely moves a state more than 2–3 ranks.
Key assumptions and limitations
1. 100% retail-rate offset. The model values every generated kWh at the full residential retail rate. In practice, households self-consume ~60–80% directly; excess exports are credited under net metering (often at retail, sometimes at avoided-cost). States weakening net metering will see longer real paybacks.
2. No rate escalation. Utility rates are held at July 2026 levels. EIA data shows residential rates rising ~5%/yr nationally; including escalation would shorten all paybacks.
3. No degradation, O&M, or financing. Panels degrade ~0.5%/yr; inverters may need replacement; loan interest adds cost. Cash-purchase basis assumed.
4. No federal credit. Correct for homeowner-purchased systems installed in 2026+. Third-party-owned (lease/PPA) systems may still access the 48E commercial credit — a different market not modeled here.
5. State incentives as modeled are upfront-equivalent; SC’s carryforward timing and MA’s SMART production payments are noted but not time-discounted.
6. Single rate per state. EIA state averages blend utilities; individual bills vary widely (e.g., California IOU vs. municipal rates).
Sensitivity analysis
| Scenario | Median payback | Hawaii | North Dakota |
|---|---|---|---|
| Base case | 15.6 yrs | 4.4 yrs | 20.2 yrs |
| +3%/yr rate escalation (25-yr levelized) | ~13.0 yrs | ~4.2 yrs | ~16.0 yrs |
| 70% self-consumption, export at 50% retail | ~18.4 yrs | ~5.2 yrs | ~23.7 yrs |
| Installed cost $3.00/W (cash-purchase median) | ~13.0 yrs | ~3.7 yrs | ~16.8 yrs |
| Installed cost $4.50/W (loan-financed median) | ~19.5 yrs | ~5.5 yrs | ~25.2 yrs |
Data confidence
- Electricity rates: High. EIA Form EIA-861M, preliminary July 2026. Official, comprehensive.
- Installed cost: High. LBNL Tracking the Sun, national median $3.60/W for host-owned residential (2025 data).
- State incentives: Medium-high. Verified against 2026-dated secondary sources; programs can change mid-year.
- Capacity factors: Medium. NREL ATB classes are authoritative; state-to-class mapping is estimated.
- Overall ranking confidence: Medium-high. Rate-driven; robust to ±1 class error in most states.
Reproducibility
Raw inputs and per-state outputs: `data.csv`. Calculation script logic documented above; any analyst with the cited public sources can reproduce the ranking within rounding.