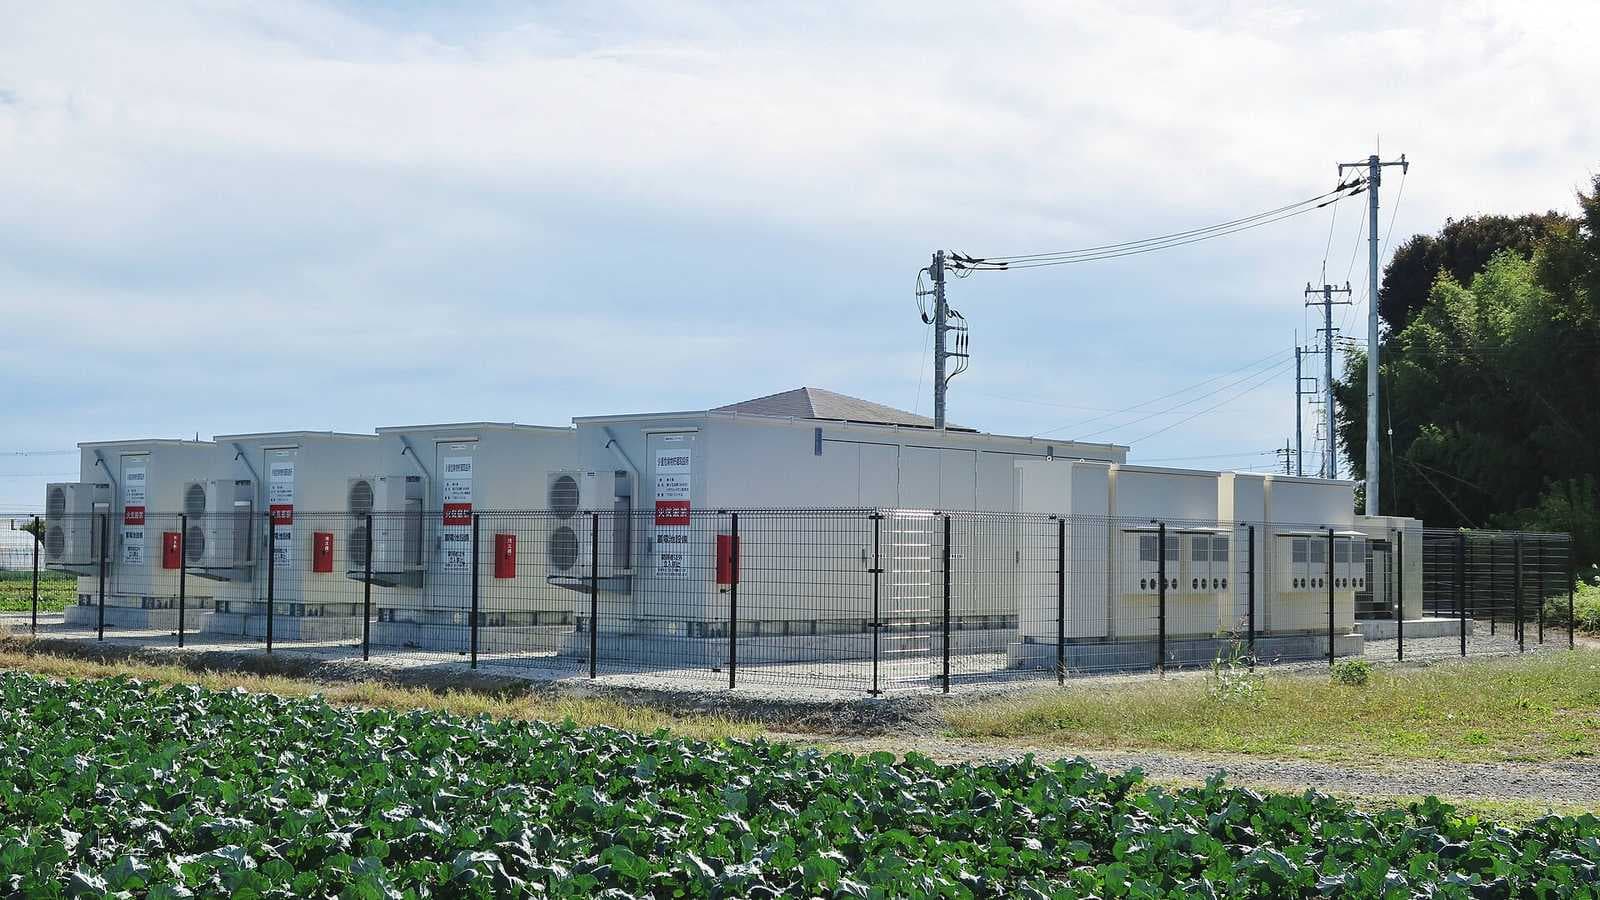
- Australia’s National Electricity Market held a record 20.17 GWh of energy in grid batteries at 4:15 pm on Friday 6 November 2026, up 203% on the 6.66 GWh peak set on 5 November 2025.
- Solar availability also set a record at 10,561 MW, yet 41.36 GWh of renewable output was curtailed across the same day.
- New South Wales accounted for 15.68 GWh of the curtailed energy, almost entirely solar, while its batteries held a record 8.36 GWh.
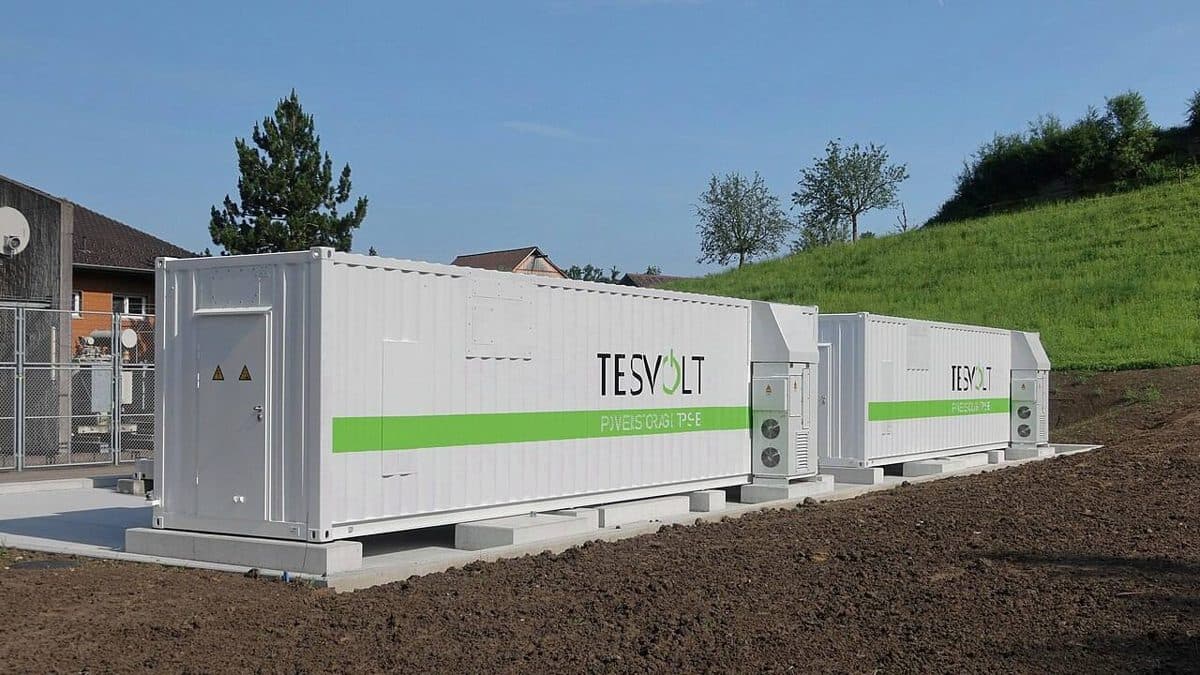
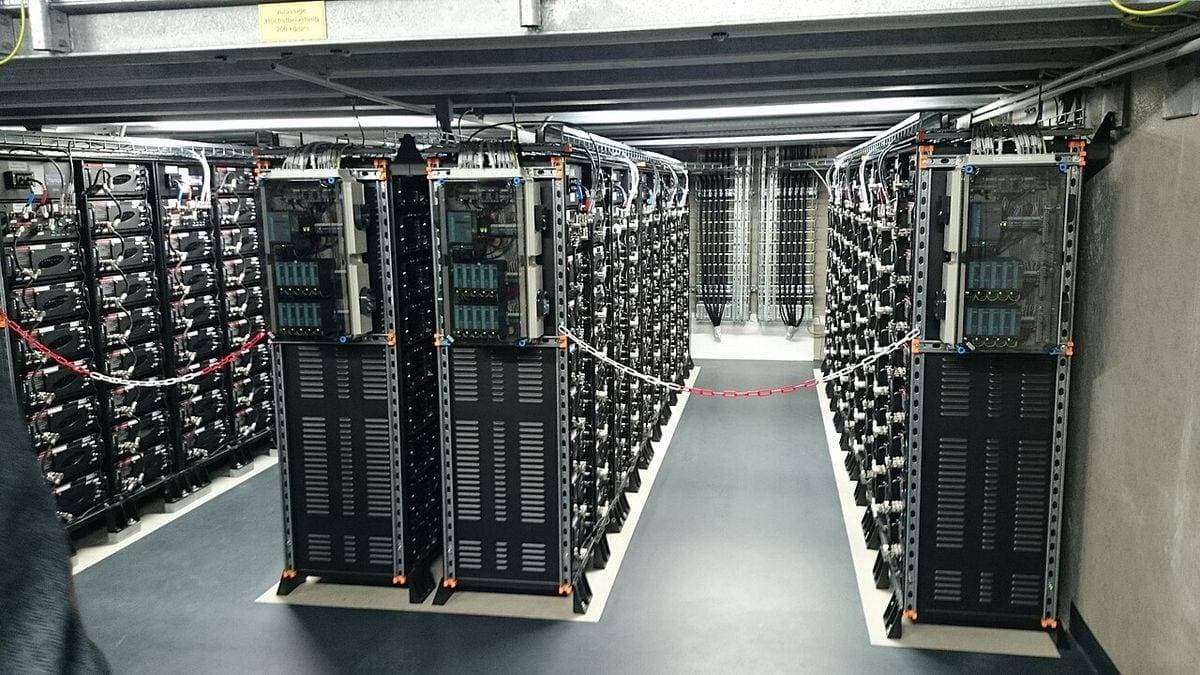
The Australia battery storage record set last week says less about how much hardware the market now owns than about how much of it the market can actually use. Connection queues keep filling, new projects keep switching on, and the fleet keeps setting highs. The binding constraint has moved downstream, to wires, dispatch rules and where the storage sits relative to the solar flooding the middle of the day.
The figures come from Geoff Eldridge of consultancy Global Power Energy, published through its GPE NEMLog service and reported by RenewEconomy on 10 November. Eldridge tracks the National Electricity Market, the grid that serves eastern and south-eastern Australia, and his data show a market adding storage at a pace its transmission system is struggling to match.
How the Australia battery storage record was set
At 4:15 pm on Friday 6 November, batteries across the National Electricity Market held 20.17 GWh of stored energy, the highest level ever recorded. The previous peak, 6.66 GWh on 5 November 2025, lasted barely a year. New South Wales set its own record the same afternoon at 8.36 GWh, up from 2.90 GWh on 8 October 2025, a rise of 188%.
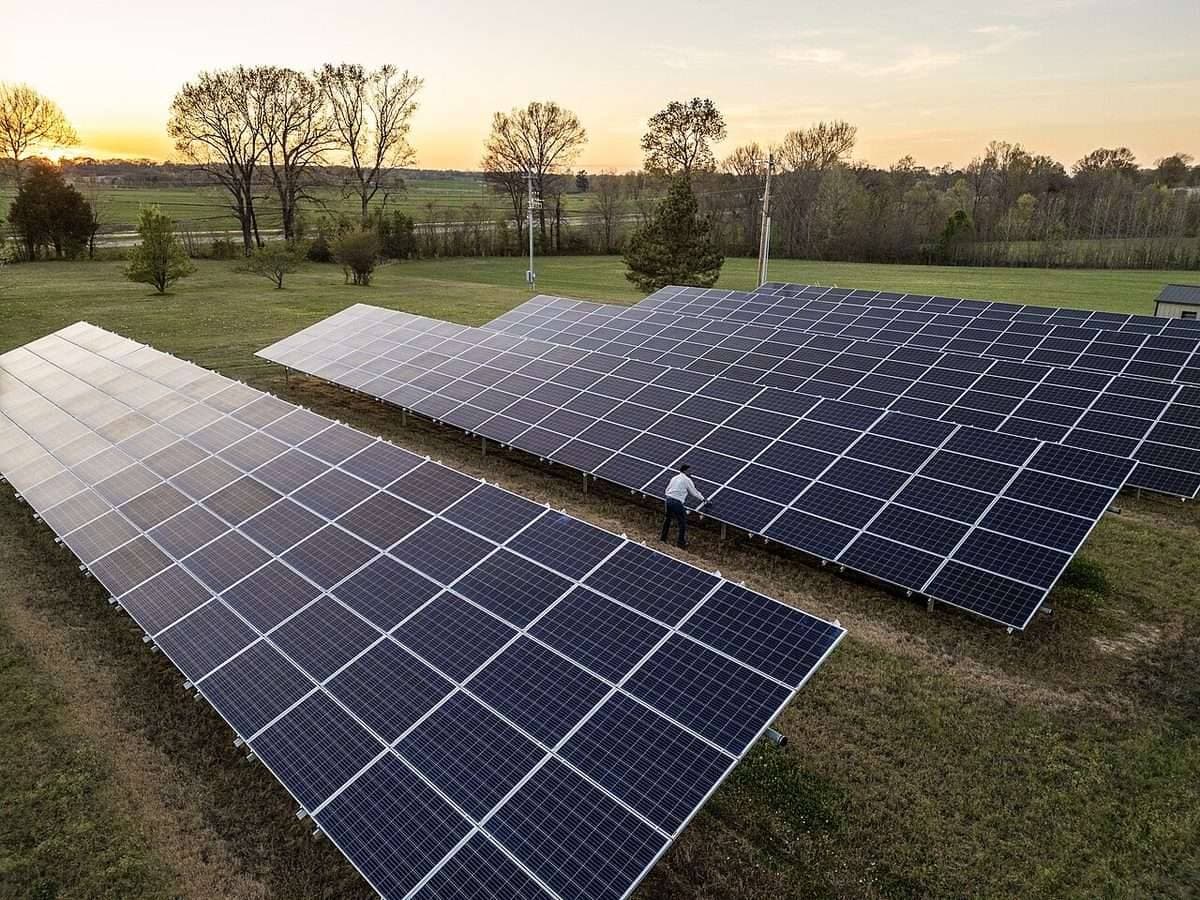
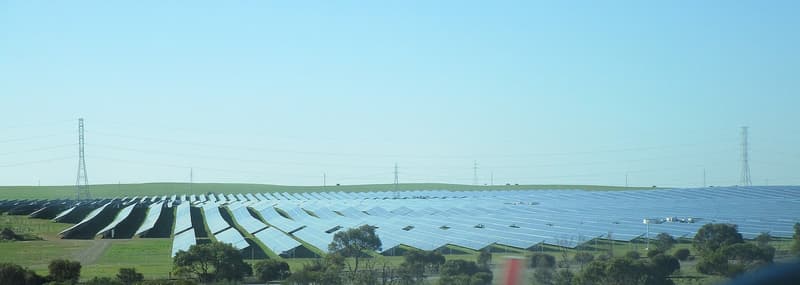
The record arrived on a day of abundant sunshine. Utility-scale solar availability across the market reached 10,561 MW, beating the 9,410 MW set on 17 October 2025 by 12%. In Victoria, utility-scale solar output peaked at 1,588 MW, up 35% on the same period a year earlier. The NEM battery stored energy record therefore reflects two trends at once: a much larger fleet, and a much larger daytime surplus for that fleet to absorb. Rooftop solar set its own October record of 3,138 MW, adding to the midday flood.
Discharge records tell the same story from the evening side. On 11 August 2026, batteries discharged at a peak of 4,325 MW, supplying 14.42% of market consumption in that interval. The fleet has grown from 261 MW of installed output at the start of 2021 to 6.1 GW by the end of 2025, according to the Australian Energy Regulator, and batteries set the wholesale price 16.3% of the time in 2025. For the mechanics of shifting solar power into the evening, see our guide to how grid-scale battery storage works.
| Record | 6 November 2026 | Previous record | Change |
|---|---|---|---|
| NEM battery stored energy | 20.17 GWh | 6.66 GWh (5 Nov 2025) | +203% |
| New South Wales battery stored energy | 8.36 GWh | 2.90 GWh (8 Oct 2025) | +188% |
| NEM solar availability | 10,561 MW | 9,410 MW (17 Oct 2025) | +12% |
| Victoria utility-scale solar output | 1,588 MW | Not stated in source | +35% year on year |
41.36 GWh curtailed on the same day
Even with batteries holding a record charge, renewable curtailment in Australia kept climbing. Across 6 November, an estimated 41.36 GWh of renewable generation was curtailed across the market, 26.67 GWh of solar and 14.69 GWh of wind. New South Wales accounted for 15.68 GWh of that total, almost entirely solar. Solar made up 64.5% of the curtailed energy across the market, on Joule Post arithmetic from the published split.
The most striking detail sits inside the New South Wales figure. The state set a record daily mean of 646.82 MW curtailed during positive-price intervals, equal to 15.52 GWh over the day, beating the 635.47 MW set on 10 January 2026. Curtailment during positive prices means output was switched off while the market was still willing to pay for power, a sign that the constraint was physical, in wires and dispatch limits, rather than a lack of demand.
The pattern is now a trend rather than a single bad day. The market’s 365-day rolling mean of positive-price curtailment reached a record 246.76 MW on 6 November, equal to 2.16 TWh over a year, up from 245.06 MW the day before.
What the two-to-one curtailment gap means for the NEM
Joule Post arithmetic from the published figures puts the mismatch in plain terms. The 41.36 GWh curtailed on 6 November was 2.05 times the 20.17 GWh sitting in batteries at the afternoon peak. In New South Wales the ratio was 1.88, with 15.68 GWh curtailed against 8.36 GWh stored. And 99% of the New South Wales curtailment, 15.52 GWh of 15.68 GWh, happened while prices were positive.
A second Joule Post calculation shows the scale of the stored energy in operating terms. Discharging the full 20.17 GWh at the fleet’s record discharge rate of 4,325 MW would take about 4.7 hours, roughly one evening peak. A single day of curtailment, 41.36 GWh, equals about 1.9% of the 2.16 TWh of positive-price curtailment accumulated over the previous year.
“The question is increasingly not just how much generation and storage capability we have, but how effectively the NEM can utilise it,” Eldridge wrote. “Battery charging at the utility and consumer level, and other flexible demand can help absorb available generation, but transmission constraints, local dispatch conditions and the location of storage are also important.”
Location is doing heavy work in that sentence. Storage earns its keep when it sits close to surplus generation and can charge without hitting a network limit, then discharge into the evening peak. Storage built far from the solar, or behind a congested line, can hold a record charge on paper while solar farms nearby are switched off. The record and the curtailment are two measurements of the same grid, and both rose together. Chile’s batteries passed a similar evening-peak test, as we reported in our piece on Chile’s battery evening peak, but the Australian case is sharper because the waste and the record happened on the same day.
The build-out keeps accelerating
Nothing in the data suggests the build-out is slowing. The Australian Energy Market Operator connected a record 9.1 GW of renewables and storage to the market in the 2025-26 financial year, and its connections pipeline has grown to 75.4 GW, with batteries making up 52% of pipeline capacity. The Clean Energy Council reports that Australia became the world’s third-largest utility-scale battery market, behind the United States and China, with 4.3 GW reaching financial close in 2025 and a further 2 GW and 5.1 GWh commissioned that year, up 233% on the year before.
Money is following the same curve, unevenly. In the third quarter of 2026, 59 grid-scale batteries earned a combined AU$88.91 million (Australian dollars; US$61.35 million), according to analytics platform NEMPulse, with five days delivering 15% of the quarter’s total revenue. The record stored-energy figure shows the fleet can now hold a large charge. The revenue concentration shows that earning from it still depends on a small number of high-value days, and the curtailment figures show that the fleet still cannot reach a large share of the energy on offer.
The next test is a smaller number for curtailment arriving alongside the next record for stored energy. Until transmission, storage location and flexible demand catch up with the build-out, Australia will keep setting both records on the same day.
Sources
- RenewEconomy, “New records set for battery stored energy as big solar floods the grid, but curtailment still bites”, 10 November 2026
- Energy-Storage.News, “Australia’s NEM BESS stored energy hits record 20.17GWh, up 203% in a year”, 9 November 2026
- Geoff Eldridge, Global Power Energy, GPE NEMLog post on LinkedIn, 7 November 2026