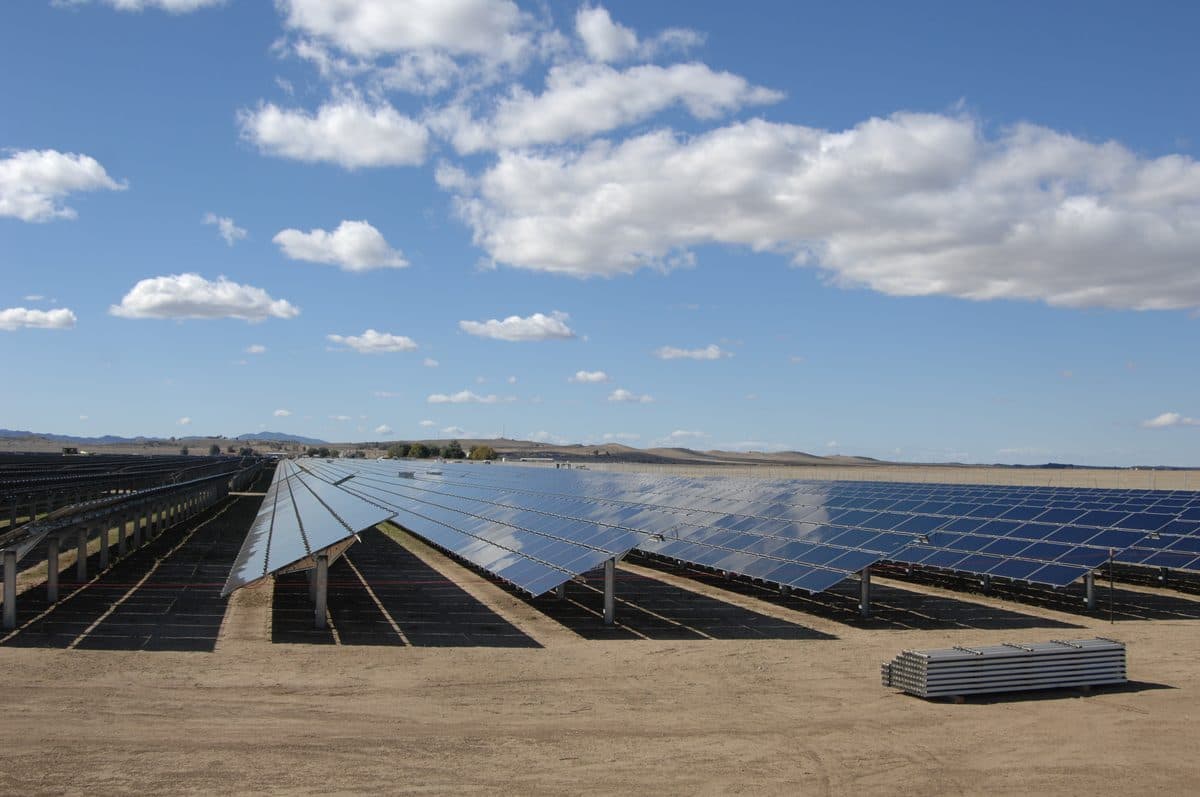
- Solar and battery storage cut summer wholesale electricity prices sharply in Texas and California while demand rose in both states.
- The saving stayed mostly at wholesale level, because transmission, distribution, and wildfire-related costs pushed overall retail bills up.
- Batteries changed when prices are set, by absorbing midday solar output and discharging into the evening ramp instead of leaving the work to gas peaker plants.
Wholesale prices are set at the margin, hour by hour, and the plants that set the price in the late afternoon used to be gas peakers running for a few expensive hours. Solar and batteries changed the identity of the marginal plant in a growing number of those hours. Panels filled the middle of the day, batteries carried that energy into the evening, and the expensive peaker stayed off or ran for fewer hours. The Solar Energy Industries Association analysis of the summers of 2021 and 2026 measures the result in dollars, and the result is large enough to matter for grid planning even though it did not reach household bills intact.
The analysis compared weighted average hourly wholesale day-ahead prices for June, July, and August in 2021 with the same three months in 2026, adjusted for inflation to 2026 dollars, across the California Independent System Operator and the Electric Reliability Council of Texas. Both grids used more electricity in summer 2026 than in summer 2021. California consumption rose 2.5 percent and Texas load rose 30.1 percent. Wholesale prices fell in both markets anyway, by 51 percent in California and 42 percent in Texas, after inflation adjustment. The association attributes the fall to the growth of solar generation and battery storage over the five years, alongside the rooftop solar growth recorded in the same period.
Peak prices fell further than average prices
Average prices tell only part of the story, because the most expensive hours drive the most costly procurement. In California, peak hourly wholesale prices dropped from $141.75 per megawatt-hour in summer 2021 to $59.69 in summer 2026, a fall of 57.9 percent on Joule Post’s calculation from the association’s figures. In Texas, peak hourly prices fell from $110.96 to $57.30, a fall of 48.4 percent. Batteries now supply 6 to 7 percent of daily energy use in California and more than 1.3 percent of energy demand in Texas, according to the association, and their discharge hours line up with the evening ramp when solar output fades and demand stays high.
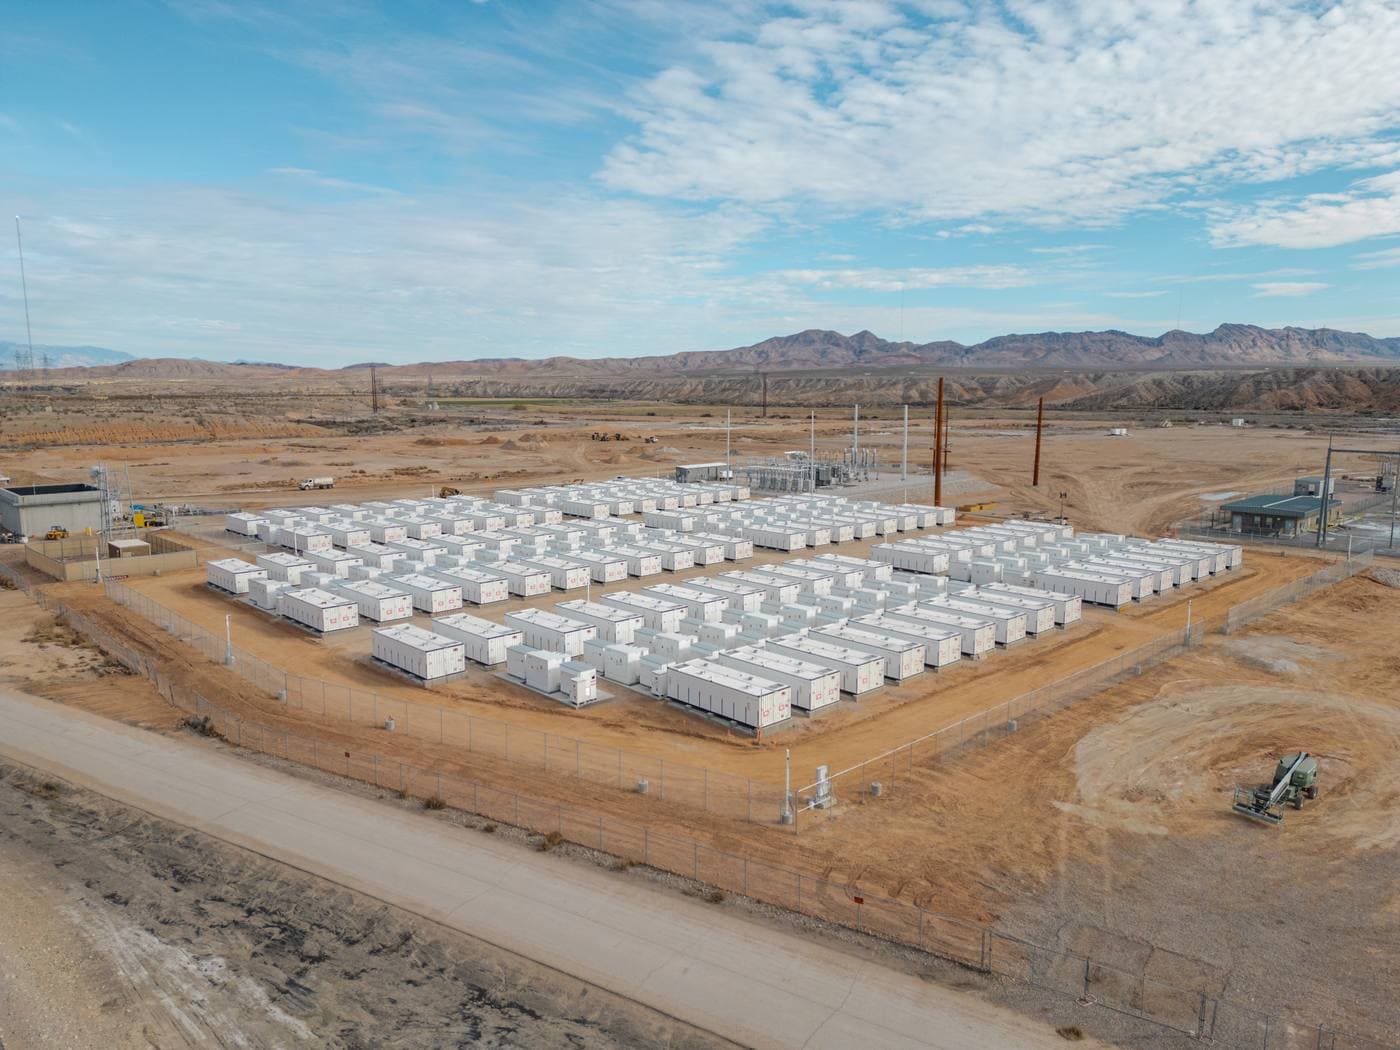
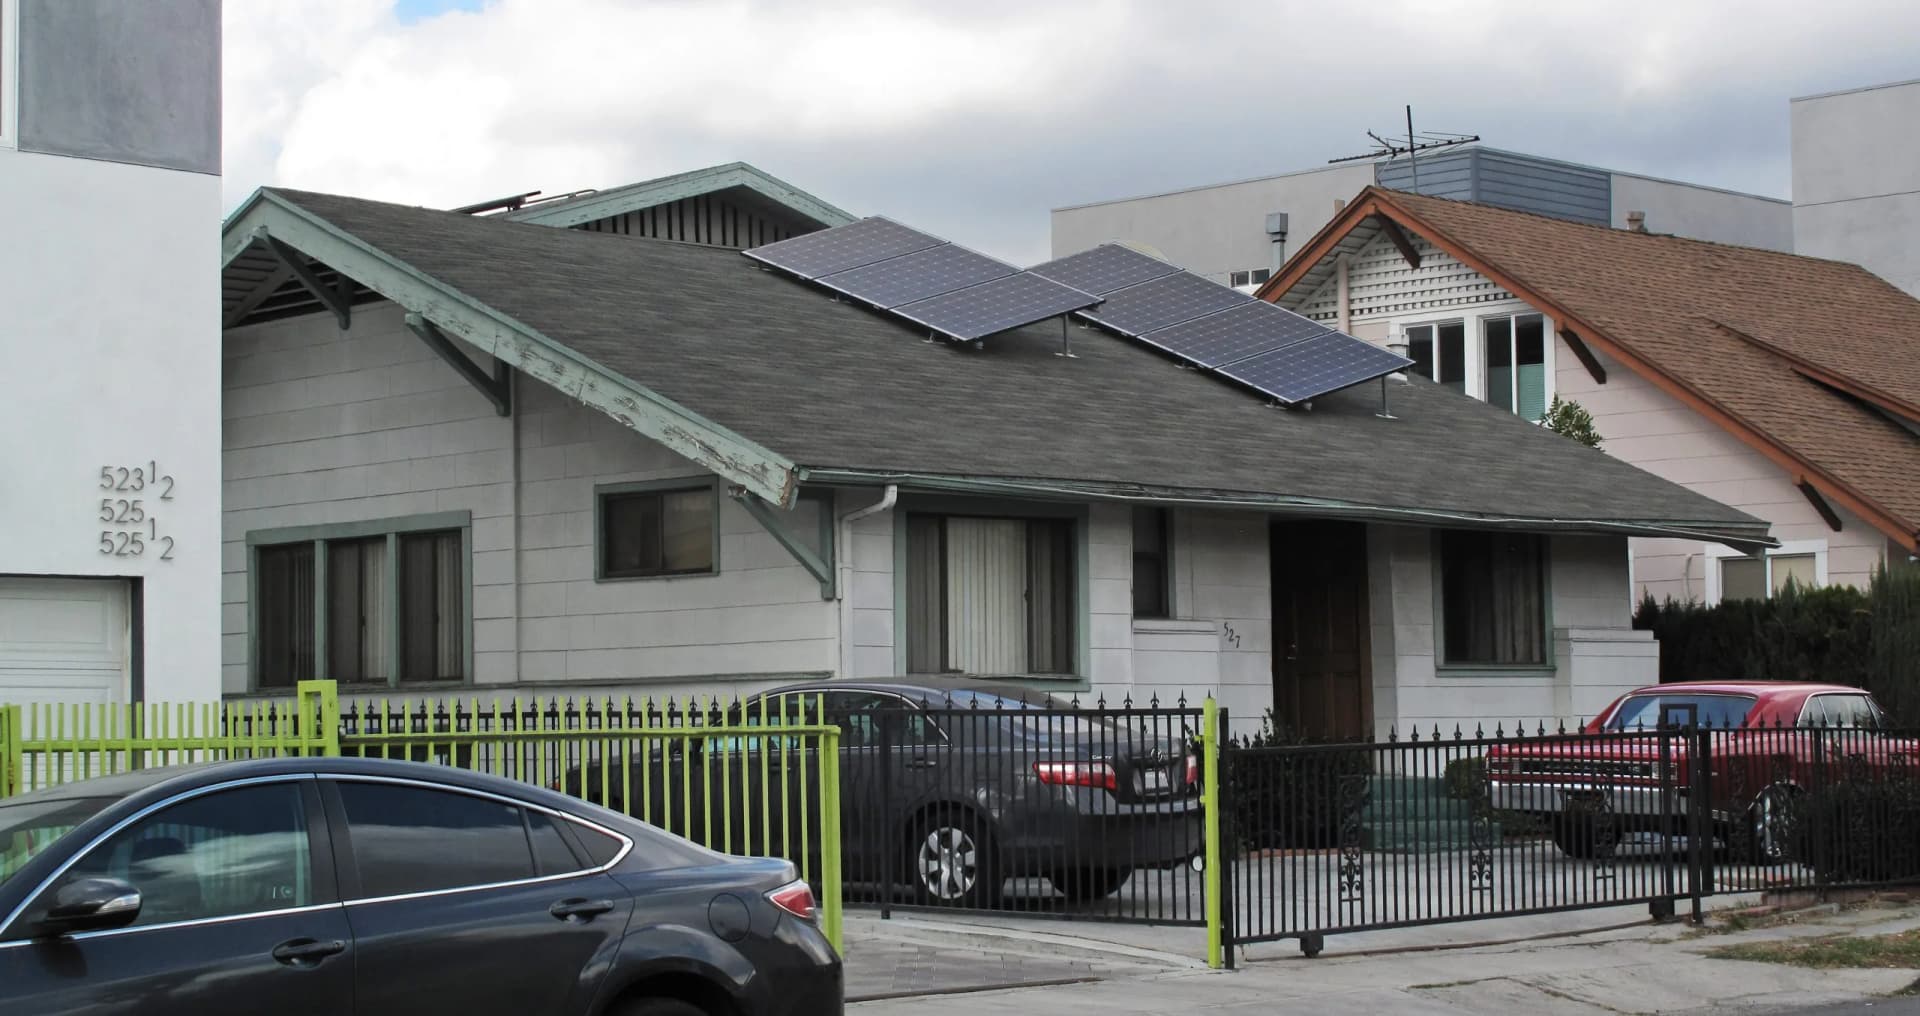
Capacity growth explains the mechanism. Solar generation rose 421 percent in Texas and 90 percent in California between 2021 and 2026. Battery storage capacity expanded from 1 gigawatt-hour in Texas in 2021 to 33.1 gigawatt-hours by the end of the first half of 2026, a rise the association describes as more than 26-fold. In California, battery capacity grew from 8.1 gigawatt-hours to 62 gigawatt-hours over the same period, described by the association as nearly sevenfold. Rooftop solar generation climbed 172 percent in Texas to 1,533 gigawatt-hours and 107 percent in California to 7,997 gigawatt-hours across the three summer months. More supply at midday plus more discharge in the evening compressed the hours when scarce peaker capacity could set a high clearing price.
| Measure, summer 2021 to summer 2026 | California (CAISO) | Texas (ERCOT) |
|---|---|---|
| Average wholesale price | $77.54 to $38.32 per MWh, down 51 percent | $54.97 to $31.77 per MWh, down 42 percent |
| Peak hourly wholesale price | $141.75 to $59.69 per MWh, down 57.9 percent | $110.96 to $57.30 per MWh, down 48.4 percent |
| Electricity consumption change | Up 2.5 percent | Up 30.1 percent |
| Solar generation growth | Up 90 percent | Up 421 percent |
| Battery storage capacity, end of H1 2026 | 62.0 GWh, from 8.1 GWh | 33.1 GWh, from 1 GWh |
| Estimated wholesale saving, June to August 2026 vs 2021 | $2.5 billion | $3.55 billion |
Peak-price percentages in the table are Joule Post’s calculations from the association’s published price figures. All other figures in the table come from the association’s analysis, published in October 2026. The pattern across both states is the same despite very different demand growth: supply growth from solar and storage outran demand growth in the hours that set prices, even in Texas, where total load rose by nearly a third.
$6.05 billion spread over 92 summer days
Adding the two state estimates gives $6.05 billion in wholesale savings across June, July, and August 2026 compared with the same period in 2021. Spread evenly over the 92 days in those three months, the combined saving averages about $65.8 million per day, or about $27.2 million per day in California and $38.6 million per day in Texas. Those daily averages are Joule Post’s calculations from the association’s totals, and they are averages only. Savings concentrate on hot, high-demand days when peak prices would otherwise spike, and they shrink on mild days when prices are already low. The daily average is useful for scale, and misleading if read as a steady daily rebate.
Scale cuts both ways. $6.05 billion over one summer is large beside the cost of the storage buildout, and small beside total annual electricity spending in two of the largest U.S. states. The association’s comparison also carries a limit that readers should keep in view. It compares two summers five years apart, and many things changed between them besides solar and storage capacity, including fuel prices, demand patterns, and grid operations. The analysis isolates the price comparison and attributes the decline to solar and storage growth, but a two-point comparison cannot separate every contributing factor. The direction of the finding is consistent with the capacity data and with the peak-hour mechanism, while the exact dollar split between causes remains an estimate rather than a metered fact.
Retail bills rose while wholesale costs fell
Households did not receive the wholesale saving as a bill cut, and the association says so directly. Residential generation costs fell 10 percent in California and 4 percent in Texas, but overall retail bills faced upward pressure from rising transmission and distribution expenses. In California, transmission costs rose 12 percent, distribution costs climbed 51 percent, and other costs including wildfire management overhead rose 90 percent, leaving the overall bill price 22 percent higher. In Texas, transmission and distribution costs increased 17 percent and 23 percent respectively, leaving the overall bill price 3 percent higher. The generation portion of the bill shrank while the wires and wildfire portions grew faster.
That split reframes the affordability debate. Solar and storage lowered the cost of the energy itself, while the cost of moving that energy and hardening the grid against fire risk rose. A policy debate that credits or blames solar alone for the retail bill misses the larger driver in California, where distribution and wildfire-related costs did most of the upward work. The same split also sets the stakes for storage policy. Batteries reduce wholesale costs by shifting energy across hours, but they do not reduce the cost of poles, wires, and vegetation management, and a grid that adds both storage and wires spending can show falling wholesale prices and rising retail bills at the same time. Both facts can be true, and in summer 2026 both were.
The finding lands in a political season, and the association framed it that way. Tim Pawlenty, chief executive officer and president of the Solar Energy Industries Association, said delivering affordable, reliable power is a priority that transcends party lines and that Texas and California are proof the growth of solar and storage is driving down prices. The quote is verbatim from the association’s coverage of the analysis. Readers should weigh it as an industry association’s interpretation of its own analysis, not as an independent audit. The underlying price, capacity, and consumption figures come from market data the association compiled, and the peak-price and daily-average calculations in this article are Joule Post’s own arithmetic from those figures.
Storage pairing is becoming the default for new solar
The summer price result fits a wider buildout pattern reported separately by the U.S. Energy Information Administration. More than 16 percent of new utility-scale solar capacity added in the United States in 2026, as of September, was co-located with operable battery storage, up from 2 percent in 2017, and plans for 2027 and 2028 put the share above 30 percent, as Joule Post reported from the administration’s data. Pairing changes what a solar project sells. A standalone array sells energy when the sun shines, including hours when prices are lowest. A paired project can store midday output and sell it into the evening ramp, which is the same shift that compressed peak prices in the association’s summer comparison.
For households, the wholesale result matters indirectly. Lower wholesale prices reduce the generation portion of retail bills and reduce the cost of serving new demand from data centers, electrified transport, and heat pumps, but they do not by themselves fix the wires costs that now dominate bill growth in California. For grid planners, the result strengthens the case for pairing storage with solar at utility scale, and for valuing storage by the peak hours it displaces rather than by its nameplate capacity alone. Winter performance still depends on the full system, including how panels behave in cold and snow and how batteries are sized for longer cloudy periods, topics covered in Joule Post’s guide to how solar panels work. The summer of 2026 showed what solar plus storage can do to prices when the sun is strong. The test ahead is whether the same pairing, at larger scale, can hold prices down through winter evenings and multi-day cloudy periods.