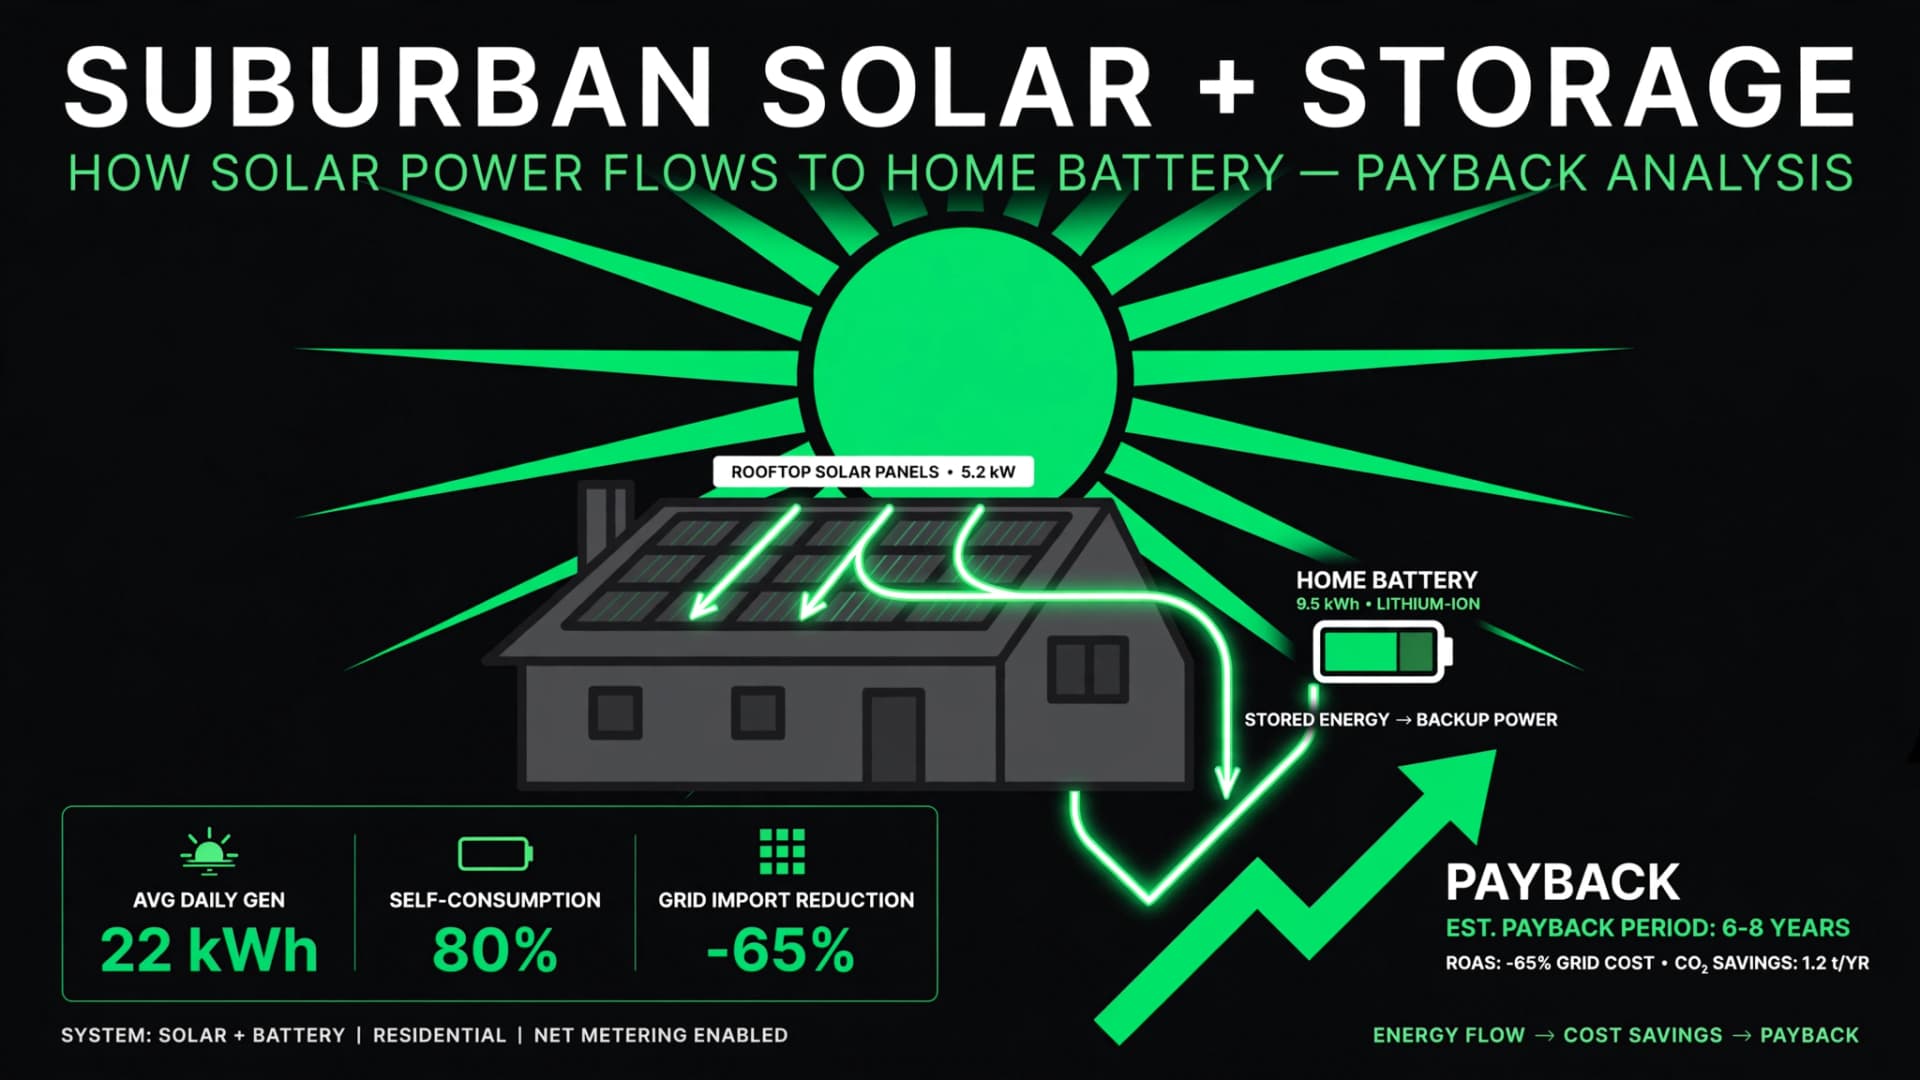
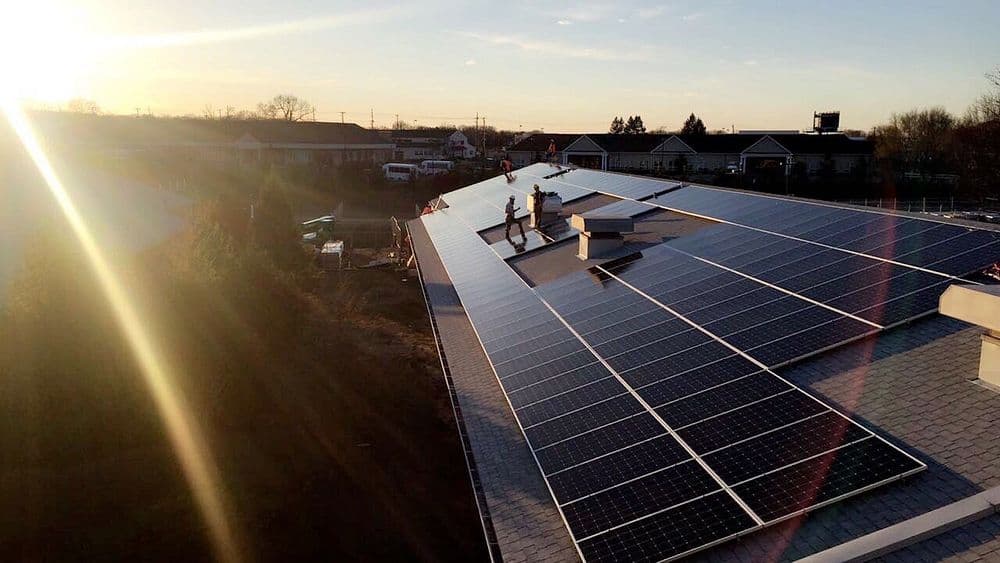
- The EIA reports that over 16 percent of new utility-scale solar capacity added in 2026 is co-located with operable battery storage, against 2 percent in 2017.
- Plans for the final three months of 2026 point to 19 percent, and plans submitted for 2027 and 2028 point to more than 30 percent.
- Co-located plants can send solar output to the grid or to the battery, depending on wholesale prices, which lets them sell into higher-priced evening hours.
Solar battery storage co-location has moved from an exception to the default design for new utility-scale solar, and the driver is wholesale price shape rather than subsidy design. The United States Energy Information Administration explains the mechanism in its 30 October 2026 analysis: prices in regions with large solar shares tend to fall when solar output is high and rise as solar output falls. A plant that pairs panels with a battery can hold midday generation and release it when prices recover, managing combined output for value across the day. The same analysis puts a scale on how fast developers have adopted that design.
As of September 2026, over 16 percent of new utility-scale solar capacity added during the year is co-located with operable battery storage, the EIA reports, based on data operators report to the agency. The comparable figure for 2017 was 2 percent. Reported plans for solar additions due online in the final three months of 2026 could lift the 2026 share to 19 percent. Longer-term plans submitted for 2027 and 2028 put the share above 30 percent. The EIA is careful about what its inventory tracks: solar and battery units at the same plant often enter commercial service at different times, and the EIA-860 and EIA-860M collections follow both through a monthly summary that identifies co-located technologies.
How the EIA solar battery storage co-location figure compares with the installed stock
The flow of new capacity is changing faster than the installed stock, which is the normal pattern when a design turns over. As of September, solar photovoltaic capacity made up 13 percent of total United States utility-scale generating capacity, and 18 percent of that solar capacity was co-located with battery storage, according to the EIA. Multiplying those two published shares gives about 2.3 percent of all utility-scale capacity in solar-plus-battery form, a Joule Post calculation from EIA figures rather than an EIA headline. The new-build share of over 16 percent sits below the 18 percent stock share for co-located solar, because the stock figure counts every co-located solar plant already built, while the flow figure counts only capacity added during 2026. Both point the same way: pairing is now routine at utility scale.
Geography sharpens the picture. The EIA reports that the share of solar generation co-located with battery capacity in California, Arizona, New Mexico, and Nevada is more than double the national average. Those Southwest states also carry higher-than-average solar shares of total generating capacity. The pattern fits the price mechanism. Where solar penetration is high, midday prices fall furthest, so the value of shifting output to the evening rises furthest, and developers respond by building storage alongside panels. California offers the clearest residential parallel. Lawrence Berkeley National Laboratory data reported in October 2026 show battery storage paired with 37 percent of new residential solar installations in 2025, up from 25 percent in 2024, with California at 74 percent. The residential and utility figures cover different years and different populations, so they are not a like-for-like comparison, and the direction matches in both markets.
| Measure | Figure | Source and basis |
|---|---|---|
| New utility solar with battery, 2017 | 2 percent | EIA, operator-reported data |
| New utility solar with battery, 2026 to September | Over 16 percent | EIA, operator-reported data |
| New utility solar with battery, 2026 full year on reported plans | Could reach 19 percent | EIA, plans for final three months |
| New utility solar with battery, 2027 to 2028 plans | Over 30 percent | EIA, plans submitted |
| Installed solar capacity co-located with battery, September 2026 | 18 percent of solar capacity | EIA, EIA-860M inventory |
| New residential solar with battery, 2025 | 37 percent, up from 25 percent in 2024 | Lawrence Berkeley National Laboratory |
What the 30 percent pipeline means for evening power prices
A pipeline above 30 percent changes what solar means for the grid. Solar alone produces most in the middle of the day, when demand in high-solar regions is often already met. Solar paired with storage produces across a longer window, because the battery discharges as solar output falls and wholesale prices rise. The EIA frames the choice at plant level: operators direct output to the grid or to the battery depending on wholesale prices. At system level, the same choice moves generation from low-price hours to high-price hours, which trims the midday surplus and adds supply to the evening ramp. The effect is visible in California, where the EIA reported in June 2026 that battery discharge had tripled over two years and solar generation had passed natural gas generation in the first five months of the year.
The 2026 build-out behind the EIA figures is large in absolute terms. In February 2026, the agency reported developers planned to add 43.4 GW of new utility-scale solar capacity and 24 GW of utility-scale battery storage during the year, with Texas hosting 40 percent of planned solar additions and 53 percent of planned storage additions. A single Texas project, Tehuacana Creek 1 Solar and BESS at 837 MW of solar with 418 MW of storage, illustrates the new template at project scale. The co-location share counts capacity, not projects, so large hybrid plants move the national figure faster than small ones. Readers should also note the limit in the EIA release: these are operator-reported plans and inventory data as of September, and plans for 2027 and 2028 can slip, shrink, or change technology mix before construction.
For households, the utility-scale shift reinforces the economics covered in the Joule Post guide to time-of-use rates and battery strategy and in the battery storage explainer. The grid value of stored solar rises where export prices fall at midday, which is why residential attachment rates climbed fastest under California net billing rules. The utility data add a second leg: developers are making the same calculation at gigawatt scale, without waiting for household policy to catch up. The next EIA inventory update will show whether the 19 percent full-year figure lands, and whether the 2027 pipeline holds above 30 percent as projects move from plans to steel.
Sources: U.S. Energy Information Administration, The share of solar generation with co-located battery storage is increasing (30 October 2026); Energy Storage News, Battery storage paired with 37% of new US residential solar in 2025 (Lawrence Berkeley National Laboratory data); U.S. Energy Information Administration, New U.S. electric generating capacity expected to reach a record high in 2026.