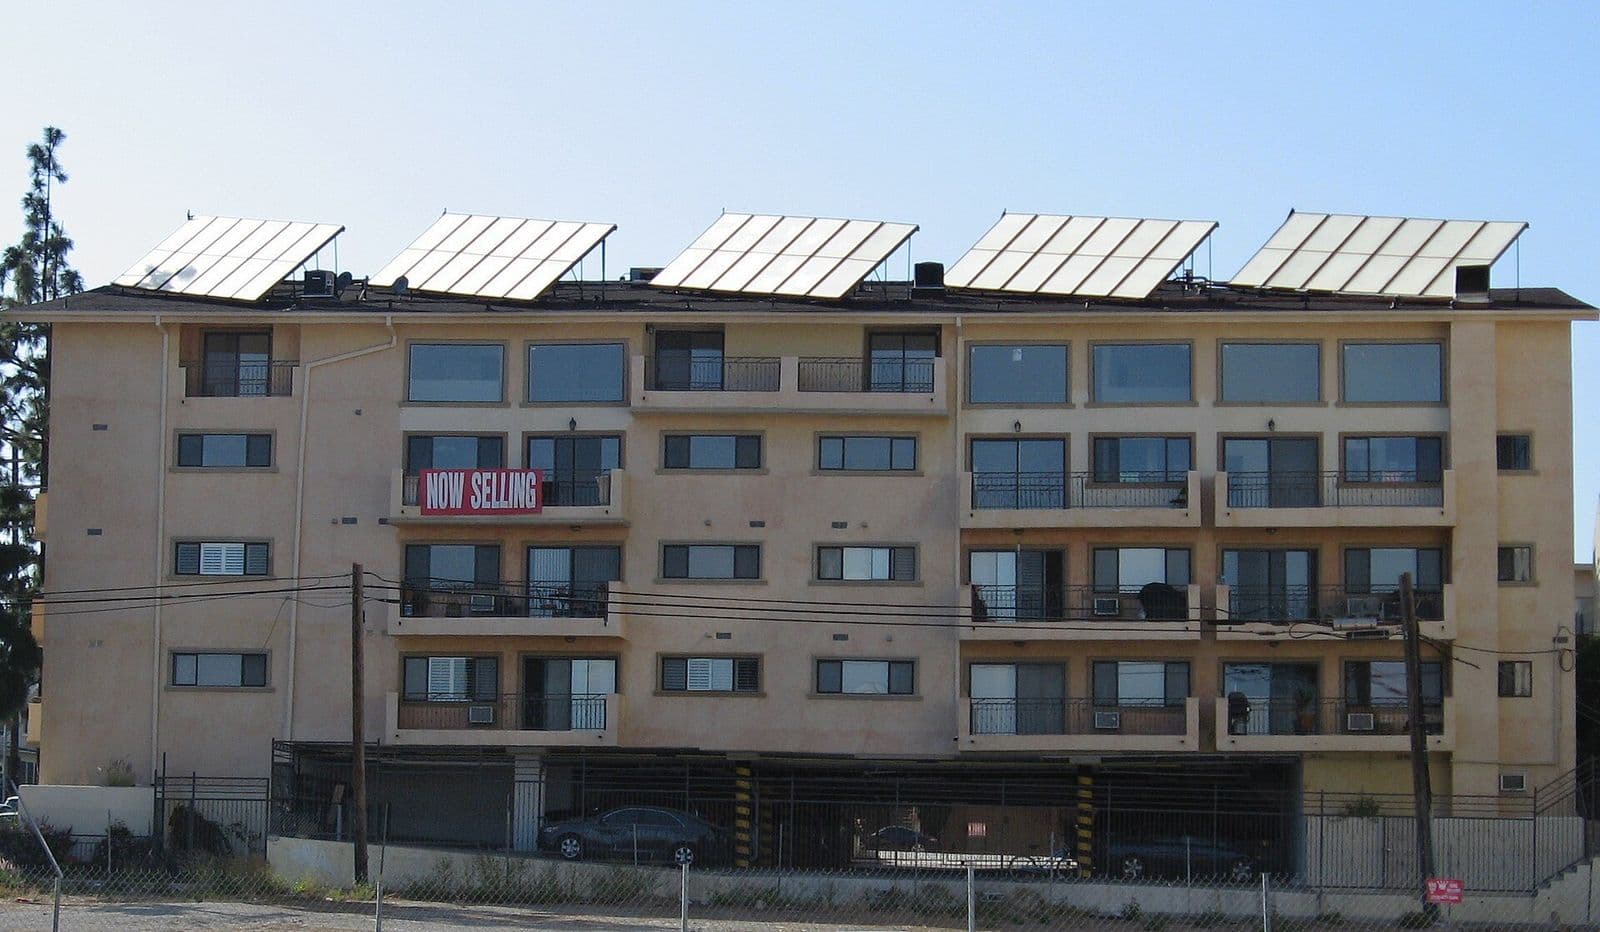
- Australia installed 3,138 MW of rooftop solar in the first ten months of 2026, 41% more than the same period in 2025 and the highest January-to-October tally on record, according to market analyst SunWiz.
- October added 304.8 MW, the strongest October in four years, with New South Wales leading at 89.9 MW and Victoria posting the fastest growth at 10.8%.
- Home batteries passed 1 GWh in a single month for the first time since April, reaching 1,043 MWh as average system size climbed to 26.74 kWh.
The surge has a policy engine behind it. The federal Cheaper Home Batteries rebate only discounts storage paired with solar, so households that had never installed panels are now buying both at once, and households that already had panels are upgrading them to match bigger batteries. A second boost arrives this month: the Small-scale Renewable Energy Scheme now covers commercial systems up to 1 MW, ten times the former 100 kW ceiling, although applications for the new certificates do not open until mid to late November.
SunWiz’s monthly update, reported by pv magazine Australia on 5 November and RenewEconomy on 6 November, shows October registrations of 304.8 MW across systems from 0 to 100 kW, up 1.07% on September’s 301 MW. It was the second straight monthly gain after an 11.5% dip in August to 285 MW, and the strongest October of the last four years: 16% above October 2025, when 262 MW was registered, and 11% above October 2024, at 274 MW. Volumes have run above every prior year since June.
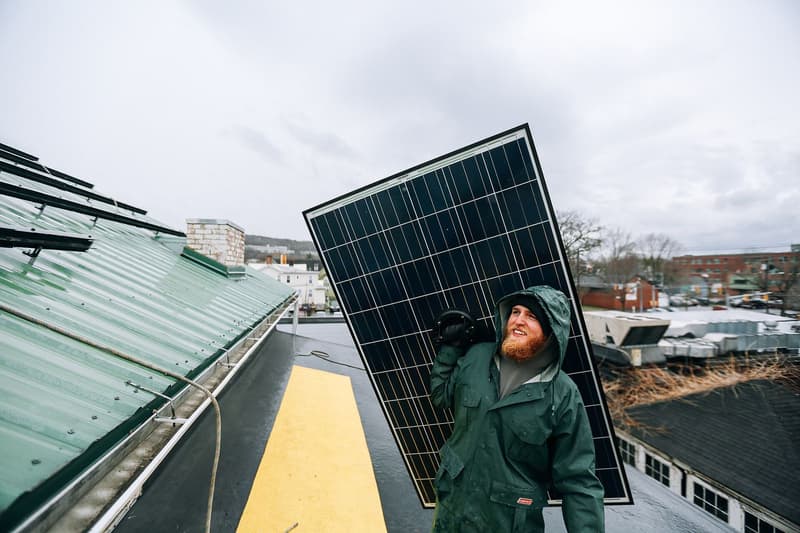
October added 305 MW, the strongest October in four years
The January-to-October tally of 3,138 MW is the highest on record and runs 41% ahead of the same point in 2025. Working backwards from that growth rate, the first ten months of 2025 totalled about 2,226 MW, so 2026 has added roughly 912 MW more rooftop capacity than last year over the same stretch. (Joule Post arithmetic from the SunWiz figures.) With two months still to run, 2026 is already Australia’s biggest year for rooftop solar.
The mix is shifting toward larger homes and small businesses. The 15 to 20 kW band posted the standout gain, up 6.7% or about 3.0 MW in the month, followed by 20 to 30 kW at 5.2%, 30 to 50 kW at 2.7% and 0 to 15 kW at 1.0%. The 10 to 15 kW band remains the backbone of the market at 115.8 MW, more than double the 6 to 8 kW band at 49.7 MW and the 15 to 20 kW band at 47.4 MW. At 115.8 MW of a 304.8 MW month, the 10 to 15 kW band alone supplied 38% of October’s capacity. (Joule Post arithmetic.)
One segment is deliberately waiting. Combined 20 to 100 kW volume fell to 32.3 MW from 35 MW, the lowest October of the four years shown and about 25% below the 2023 to 2025 range of 42 to 43 MW. Larger commercial bands fell hardest, with 75 to 100 kW down 42% and 50 to 75 kW down 24%. The cause is timing: the expanded scheme covers systems installed from 1 October, but certificate applications for mid-scale systems do not open until mid to late November, so commercial buyers are holding registrations until the subsidy is claimable.
Average system size rose to 10.05 kW from 9.88 kW, back above 10 kW for the first time since April, though still below April’s 11.75 kW and December’s 12.10 kW. At that average, October’s 304.8 MW represents roughly 30,300 individual installations in a single month. (Joule Post arithmetic.)
New South Wales leads while Victoria posts the fastest growth
New South Wales installed the most capacity in October at 89.9 MW, 5% more than September, ahead of Queensland at 75.8 MW and Victoria at 60.2 MW. The three states together supplied 225.9 MW, or 74% of the national month. (Joule Post arithmetic.) New South Wales widened its lead over Queensland from about 4 MW to 14 MW in a single month.
Victoria posted the strongest growth, up 10.8% on September, followed by Western Australia at 5.3%. Every other state and territory fell: the Northern Territory dropped 17.1%, the Australian Capital Territory 9.1%, Queensland 7.7%, South Australia 5.8% and Tasmania 2.8%. The pattern matches the commercial pause, with the states carrying more mid-scale commercial work showing the softness while residential-led states grew.
Home batteries pass 1 GWh as systems get bigger
The battery side of the story is nearly as strong as the solar side. National home battery installations reached an estimated 1,043 MWh in October, up 9.7% on September and the first month above 1 GWh since April, when a record 3,262 MWh was installed ahead of rebate changes. October’s figure is about 32% of that April peak and nearly double the May low, which implies May installations of roughly 520 MWh. (Joule Post arithmetic from the SunWiz figures.) It was the second straight rise after a small August dip.
Growth came from bigger systems. The 20 to 30 kWh segment supplied 399 MWh of the month, ahead of 40 to 50 kWh at 273 MWh and 30 to 40 kWh at 210 MWh, and the bands from 20 kWh upward made up 85% of capacity for the month. The 20 to 30 kWh band alone was 38% of October’s battery capacity. (Joule Post arithmetic.) At the smaller end, 10 to 20 kWh rose 3% to 150 MWh and 0 to 10 kWh was flat at 11 MWh. The national average home battery size rose for the fifth consecutive month to 26.74 kWh.
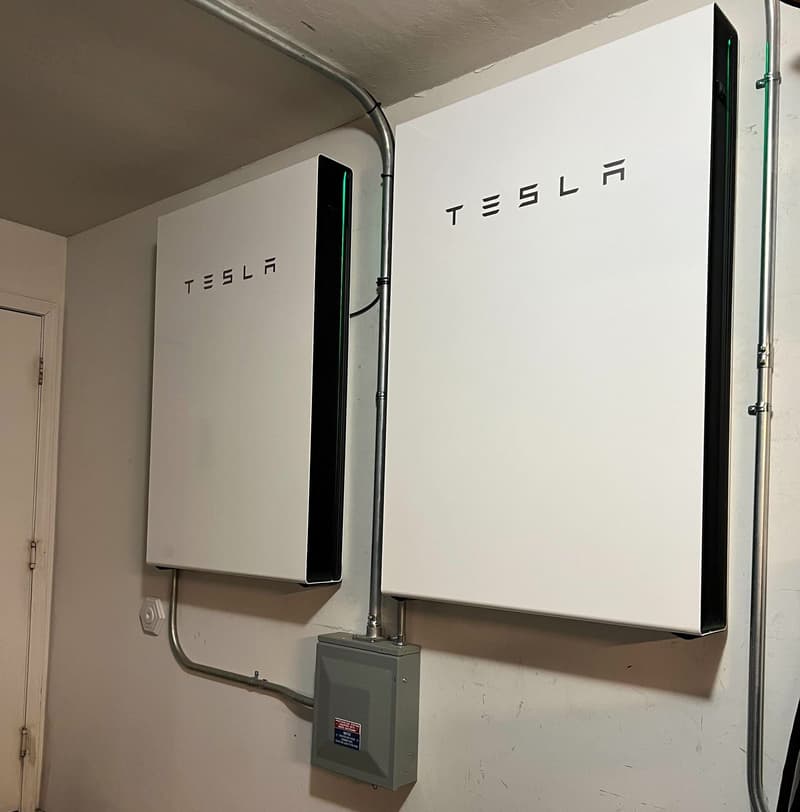
The sizing shift traces to the May 2026 rebate changes, which reduced the overall discount and steered households toward systems of 20 to 25 kWh. Homeowners responded by buying bigger batteries, and bigger batteries need bigger solar arrays to charge them, which is part of why average system size has climbed back above 10 kW. Read how the Tesla Powerwall 3 expansion packs change the maths for the hardware behind the trend, and how many panels the average home needs for the sizing behind it.
What the record run means for the rest of 2026
Two months remain in the year and the record is already secure, but the shape of November and December will say more about 2027 than about 2026. The mid-scale certificate window opening in mid to late November should release the commercial registrations held back in October, which means the 20 to 100 kW segment could rebound sharply just as the residential market heads into summer. SunWiz managing director Warwick Johnston describes the recovery as customers coming to the market in their own time, and in preparation for summer.
The deeper question is whether the rebate-driven pairing of solar and batteries holds once the early adopters are served. The April rush, the May slump and the steady recovery since show a market that reacts fast to subsidy design, and the SRES expansion is the next design change to test. For now, the numbers point one way: Australia’s rooftops are adding capacity faster than ever, and the batteries going up beside them are getting bigger every month. See how solar panels work and how grid batteries work for the technology behind the figures.
| Measure | October 2026 | Comparison |
|---|---|---|
| Rooftop solar installed in October | 304.8 MW | 262 MW in October 2025 (+16%); 274 MW in October 2024 (+11%) |
| Rooftop solar, January to October | 3,138 MW | About 2,226 MW in the same period of 2025 (+41%) |
| Average rooftop system size | 10.05 kW | 9.88 kW in September 2026; 11.75 kW in April 2026 |
| Home batteries installed in October | 1,043 MWh | 3,262 MWh in April 2026 (record); about 951 MWh in September 2026 |
| Average home battery size | 26.74 kWh | Fifth consecutive monthly gain |
| Largest state, October | New South Wales, 89.9 MW | Queensland 75.8 MW; Victoria 60.2 MW |
Sources
- Rooftop solar installations year-on-year to October up 41%, pv magazine Australia, 5 November 2026 (reporting SunWiz monthly data)
- Australia is headed for its biggest year of rooftop solar growth ever, and the mid-scale boom is yet to come, RenewEconomy, 6 November 2026 (reporting SunWiz monthly data)