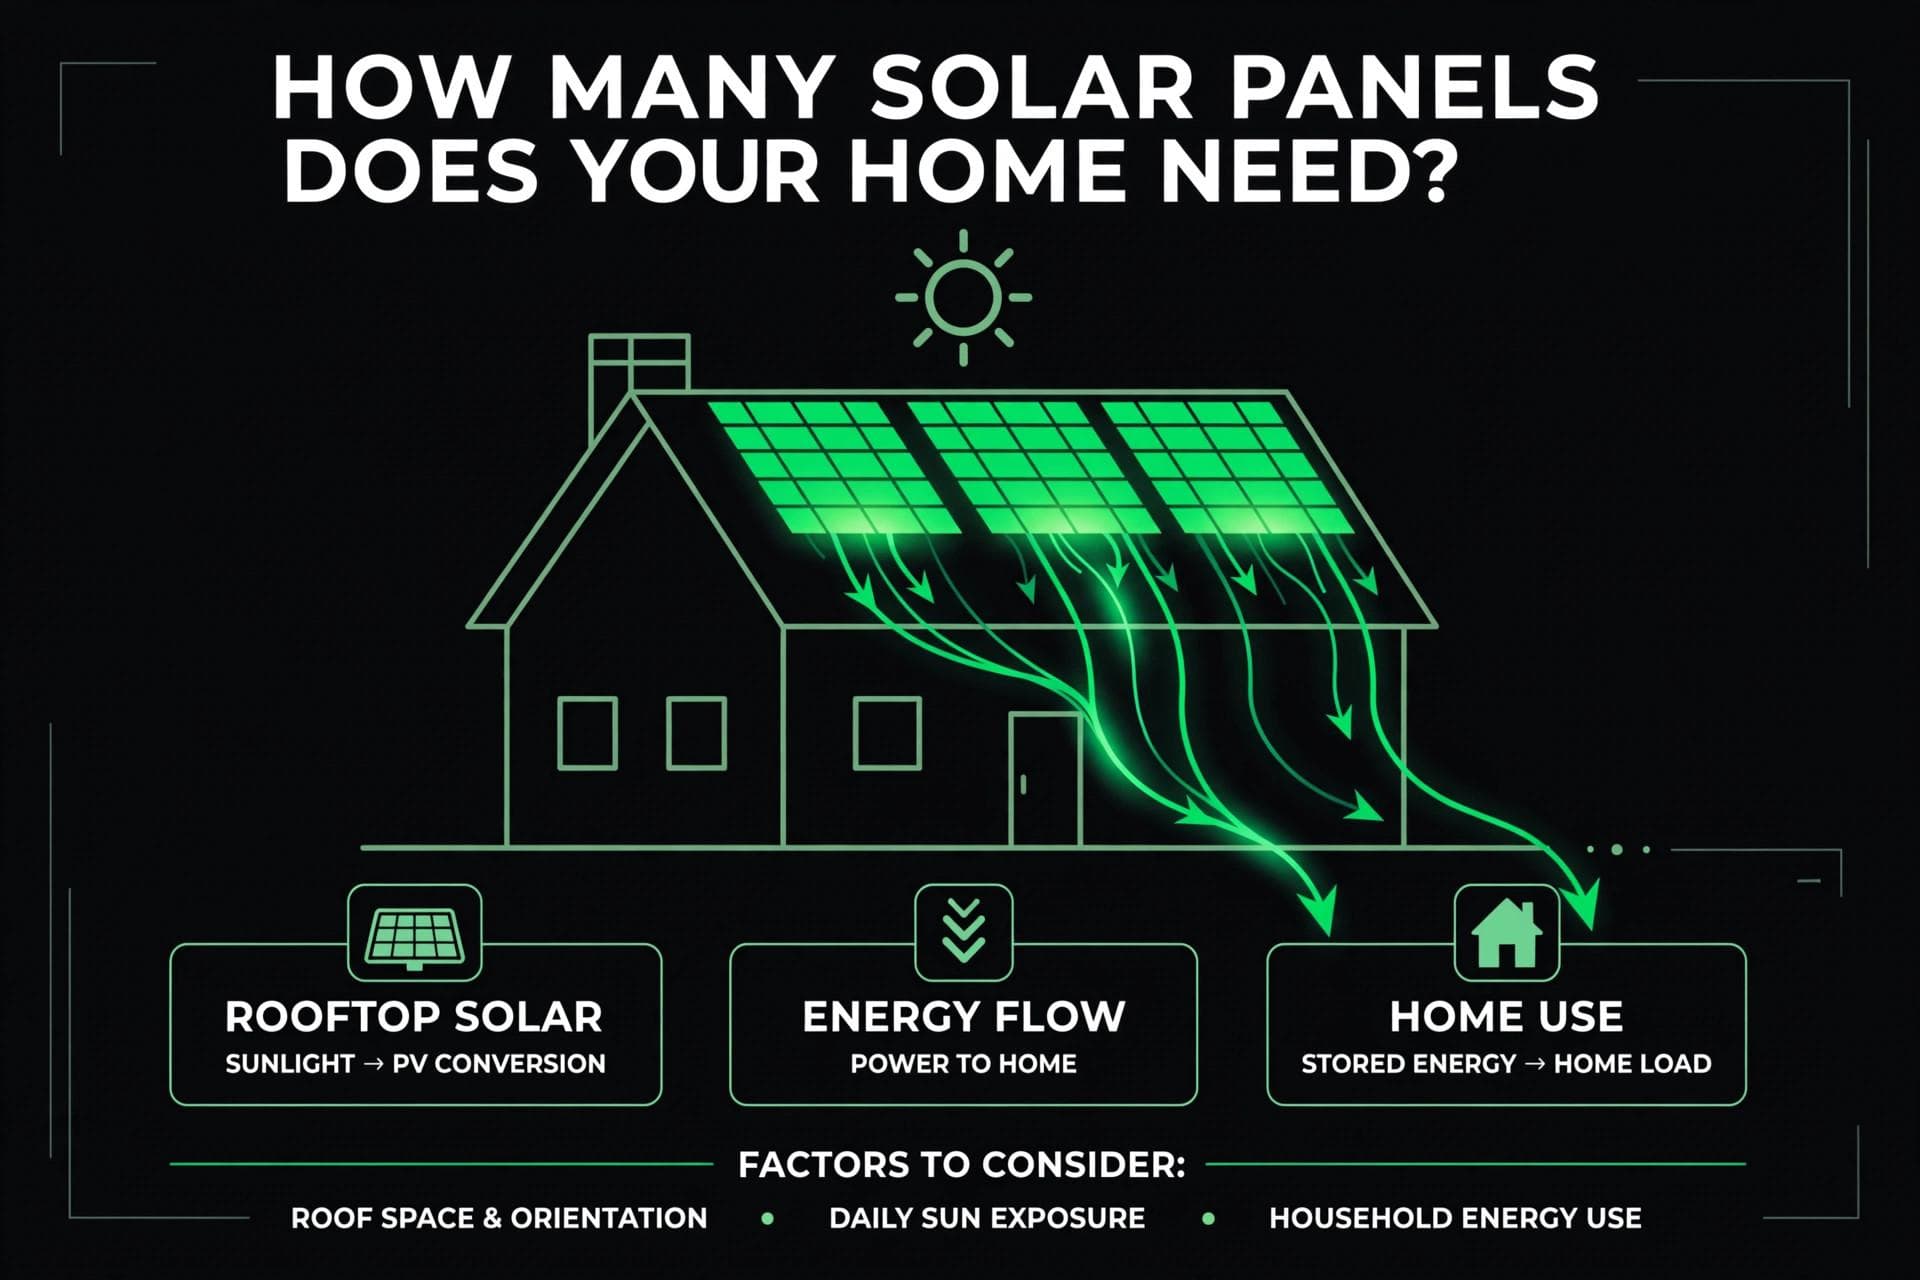
- Homeowners asking how many solar panels do I need get a state-dependent answer: 14 to 27 400-watt solar panels, depending on the state, a median of 18 panels, or about 7.2 kW of capacity.
- The gap is driven almost entirely by local sunshine: a panel in New Mexico produces twice the energy of one in Alaska, so northern homes need nearly double the panels for the same usage.
- At installed prices, that gap translates to roughly $22,400 versus $43,200 before incentives. Run NREL’s free PVWatts calculator for your own address before trusting any rule of thumb.
Solar panel sizing: The number of solar panels your home needs is your annual electricity use divided by your area’s production ratio, divided by each panel’s wattage. For the average American home, the direct answer to how many solar panels do I need works out to 14–27 modern 400W panels, fewer in sunny states, more in cloudy northern ones.
- How many solar panels do I need? The 50-state answer
- Full 50-state table: panels and yield per state
- How the sizing formula works and why people get it wrong
- What 14–27 panels costs in 2026
- The southwestern bias hidden in the 20-panel average
- Caveats: roof, shading, and net billing
- Run NREL PVWatts before you sign anything
- Frequently asked questions
The most common question homeowners ask before going solar is how many solar panels do I need and the answer is almost always a range, not a number. That’s because the question isn’t really about your house: it’s about your electricity bill and your local sunshine. For the average American household, which uses 10,791 kilowatt-hours of electricity per year according to the U.S. Energy Information Administration’s 2023 data, the answer with today’s standard 400-watt panels lands between 14 and 27 panels, depending on which state you live in. This guide shows you the full state-by-state breakdown, the simple math behind it, and the mistakes that cost homeowners thousands.
Our figures come from the same EIA state solar-yield dataset behind Joule Post’s 50-state solar payback study: we take the average home’s 10,791 kWh per year and divide it by each state’s measured small-scale solar yield per installed kilowatt, then by 400 watts per panel, rounding up to a whole panel. Real installations add roof and layout derates, so treat these as production-parity baselines, the panel count at which your panels would generate roughly as much as you use in a year.
How many solar panels do I need? The 50-state answer
The median American home needs 18 panels, about 7.2 kW of capacity. But the national average hides a two-to-one spread that makes your state the single biggest variable in sizing.
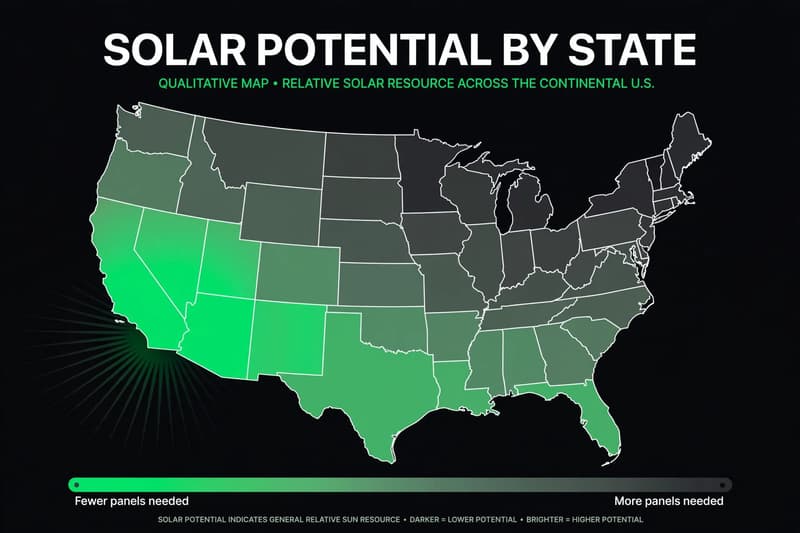
The 5 states needing the fewest panels: Arizona, Nevada, and New Mexico tie at just 14 panels (5.6 kW), followed by California and Mississippi at 15 (6.0 kW). Each 400W panel in these states produces roughly 730–815 kWh per year.
The 5 states needing the most panels: Alaska tops the list at 27 panels (10.8 kW), followed by Pennsylvania at 26 (10.4 kW), Rhode Island at 22 (8.8 kW), and Illinois and Ohio at 21 (8.4 kW). An Alaskan panel yields barely 400 kWh per year, half of what its New Mexico counterpart produces.
That range, 14 to 27, is not a rounding artifact. It is nearly a perfect mirror of sunshine: the best state yields (New Mexico, ~2,033 kWh per kW of capacity per year) are roughly double the worst (Alaska, ~1,003). Since panels = usage ÷ yield, doubling the yield halves the panel count. Everything else in sizing math is fine-tuning; geography is the main event.
Full 50-state table: panels and yield per state
The table below lists every state, sorted from fewest to most panels needed, for the average 10,791 kWh-per-year home using 400W panels. Annual yield per kW comes from EIA 2023 small-scale PV data; values marked with an asterisk are estimates per the source methodology.
| State | Annual yield per kW (kWh) | 400W panels needed | System size (kW) |
|---|---|---|---|
| Arizona | 1,953 | 14 | 5.6 |
| Nevada | 1,966 | 14 | 5.6 |
| New Mexico | 2,033 | 14 | 5.6 |
| California | 1,829 | 15 | 6.0 |
| Mississippi | 1,840 | 15 | 6.0 |
| Alabama* | 1,709 | 16 | 6.4 |
| Colorado | 1,776 | 16 | 6.4 |
| Florida | 1,710 | 16 | 6.4 |
| Georgia | 1,719 | 16 | 6.4 |
| Hawaii | 1,795 | 16 | 6.4 |
| Kansas | 1,693 | 16 | 6.4 |
| Louisiana | 1,735 | 16 | 6.4 |
| North Carolina | 1,694 | 16 | 6.4 |
| Oklahoma | 1,793 | 16 | 6.4 |
| Texas | 1,700 | 16 | 6.4 |
| Utah | 1,794 | 16 | 6.4 |
| Wyoming | 1,688 | 16 | 6.4 |
| Arkansas | 1,607 | 17 | 6.8 |
| Idaho | 1,655 | 17 | 6.8 |
| Missouri | 1,680 | 17 | 6.8 |
| Nebraska | 1,659 | 17 | 6.8 |
| South Carolina | 1,634 | 17 | 6.8 |
| Tennessee | 1,678 | 17 | 6.8 |
| Virginia | 1,632 | 17 | 6.8 |
| Indiana | 1,507 | 18 | 7.2 |
| Iowa | 1,542 | 18 | 7.2 |
| Kentucky | 1,581 | 18 | 7.2 |
| Montana | 1,525 | 18 | 7.2 |
| South Dakota | 1,522 | 18 | 7.2 |
| West Virginia | 1,533 | 18 | 7.2 |
| Wisconsin | 1,509 | 18 | 7.2 |
| Delaware | 1,484 | 19 | 7.6 |
| Maine | 1,466 | 19 | 7.6 |
| Massachusetts | 1,437 | 19 | 7.6 |
| Minnesota | 1,495 | 19 | 7.6 |
| New Hampshire | 1,440 | 19 | 7.6 |
| Connecticut | 1,379 | 20 | 8.0 |
| Maryland | 1,357 | 20 | 8.0 |
| Michigan | 1,392 | 20 | 8.0 |
| New Jersey | 1,418 | 20 | 8.0 |
| New York | 1,414 | 20 | 8.0 |
| North Dakota | 1,364 | 20 | 8.0 |
| Vermont | 1,360 | 20 | 8.0 |
| Washington | 1,358 | 20 | 8.0 |
| Illinois | 1,306 | 21 | 8.4 |
| Ohio | 1,338 | 21 | 8.4 |
| Oregon | 1,328 | 21 | 8.4 |
| Rhode Island* | 1,279 | 22 | 8.8 |
| Pennsylvania | 1,079 | 26 | 10.4 |
| Alaska | 1,003 | 27 | 10.8 |
A note on the outliers: Pennsylvania’s yield (1,079 kWh per kW) sits well below its neighbors, which pushes it to 26 panels, nearly Alaskan territory. Rhode Island and Alabama carry estimated yields in the underlying dataset, so treat their counts as approximate rather than exact.
How the sizing formula works and why people get it wrong
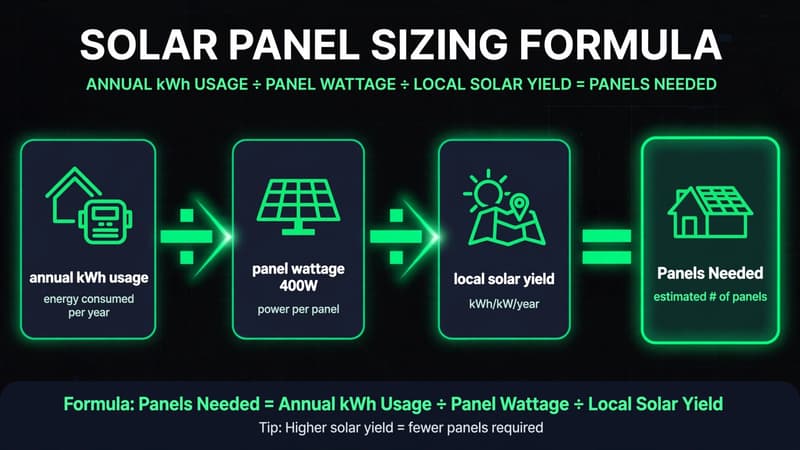
The industry-standard formula, spelled out step by step by EnergySage’s 2026 sizing guide, is short enough to fit on a napkin:
Number of panels = annual electricity usage ÷ production ratio ÷ panel wattage
Plugging in the national numbers: 10,791 kWh ÷ 1.2 (the median US production ratio, meaning each installed watt produces about 1.2 kWh per year) ÷ 440 W gives roughly 20 panels, right in the middle of our state-level results. EnergySage’s own band is 16 to 23 panels for the average home, using a production-ratio range of 1.1 to 1.6 and 440W panels. Our state data shows the true spread is wider, 14 to 27, because Alaska and a few cloudier states fall outside the national ratio range.
Where homeowners most often go wrong is confusing panel count with panel wattage. An older 300W panel and a modern 400W panel occupy roughly the same roof space (about 21 square feet each), but the 400W unit generates a third more energy. Counting panels without naming the wattage is meaningless: always ask “how many watts total,” not “how many panels.”
The other classic mistake is underestimating consumption. Homeowners’ forums are full of beginners who plan 10 panels for a house that uses 30 kWh per day, a household like that burns through roughly 11,000 kWh a year and needs close to 20 panels, double their guess. Twelve months of electric bills is the only honest starting number; everything else is a guess on top of a guess.
Finally, real systems lose energy along the way: inverter conversion, DC wiring, soiling, and shading typically shave around 14% off theoretical output (that is the default loss value NREL’s calculator applies). Inverter choice matters here too, and a microinverter-vs-string-inverter comparison can shift how much of your array’s production actually reaches your breaker box. Installers bake these losses into their quotes; your napkin math should too.
What 14–27 panels costs in 2026
Panel count translates directly to system size, and system size translates directly to dollars. Using Berkeley Lab’s national benchmark of about $4.00 per watt installed, the math is stark:
- 14 panels (5.6 kW), Arizona, Nevada, New Mexico: roughly $22,400 before incentives.
- 18 panels (7.2 kW), the median state: roughly $28,800.
- 27 panels (10.8 kW), Alaska: roughly $43,200.
The same household goal, offsetting an average electric bill, costs nearly twice as much in hardware terms in Alaska as in Arizona, purely because of sunshine. That is before incentives: a homeowner in Massachusetts may need more panels than one in Georgia but still pay back sooner, because Massachusetts retail electricity rates are roughly double Georgia’s. Panel count is only half the value story: which is exactly why we built the companion 50-state payback ranking alongside this table.
Cost benchmarks vary by source, so compare carefully. EnergySage’s installer-quote data puts the national average around $2.60 per watt, about $31,135 for their 12 kW average quoted system. Whether you anchor on $2.60 or $4.00, the key insight survives: every panel you don’t need is $800–$1,600 you don’t spend, so accurate sizing is a money decision, not a trivia question. For how the economics hold up after the federal tax credit ended, see our analysis of whether solar panels are still worth it in 2026.
Most sizing guides miss a basic skew: the national conversation about solar panel counts, “the average home needs about 20 panels,” quietly bakes in a southwestern bias. EnergySage’s 16–23 range assumes production ratios up to 1.6; our state-by-state data shows the median is actually a bit higher (18 panels at 400W) and the full range stretches to 27, because the bottom of the yield curve is worse than national ratios imply. If you live in Ohio, Pennsylvania, or New England and an online calculator hands you 18 panels, it is probably under-sizing you: using a sunnier-than-local assumption that leaves part of your bill uncovered.
The second underappreciated effect is what panel count does to payback, not just to bills. Because cost scales almost linearly with system size while electricity savings scale with your utility rate, the most expensive systems (in the cloudiest states) are simultaneously the least productive per dollar of hardware. That double penalty is the real reason Alaska’s payback math looks so rough even though its panel count is highest: you buy the most equipment to harvest the least sun. It is also why “oversize to be safe” is bad advice in the wrong state: every extra panel in a low-yield state costs the same as one in Arizona but pays back far slower.
The practical upshot: sizing is a local optimization problem with three inputs you control, your usage, your roof, your panel wattage, and one you don’t, your state’s sky. The table above settles the last one. The rest is engineering, and it’s worth getting right.
Caveats: roof, shading, and net billing
Production parity is the starting point, not the finished design. Four reality checks come before any quote:
Roof space. At about 21 square feet per panel, an 18-panel system needs roughly 380 square feet of usable, unshaded roof, after subtracting setbacks, vents, and ridgelines. If your south-facing roof only fits 12 panels, your maximum system is smaller than parity and you’ll offset a share of your bill, not all of it. Ground mounts are an option where roofs fail, but they add cost.
Shading and orientation. A single shaded panel can drag down a whole string (less so with microinverters). Our yields assume a reasonably well-sited system; a tall oak to the south of your roof can erase 10–20% of production, adding 2–4 panels to the count in a mid-yield state.
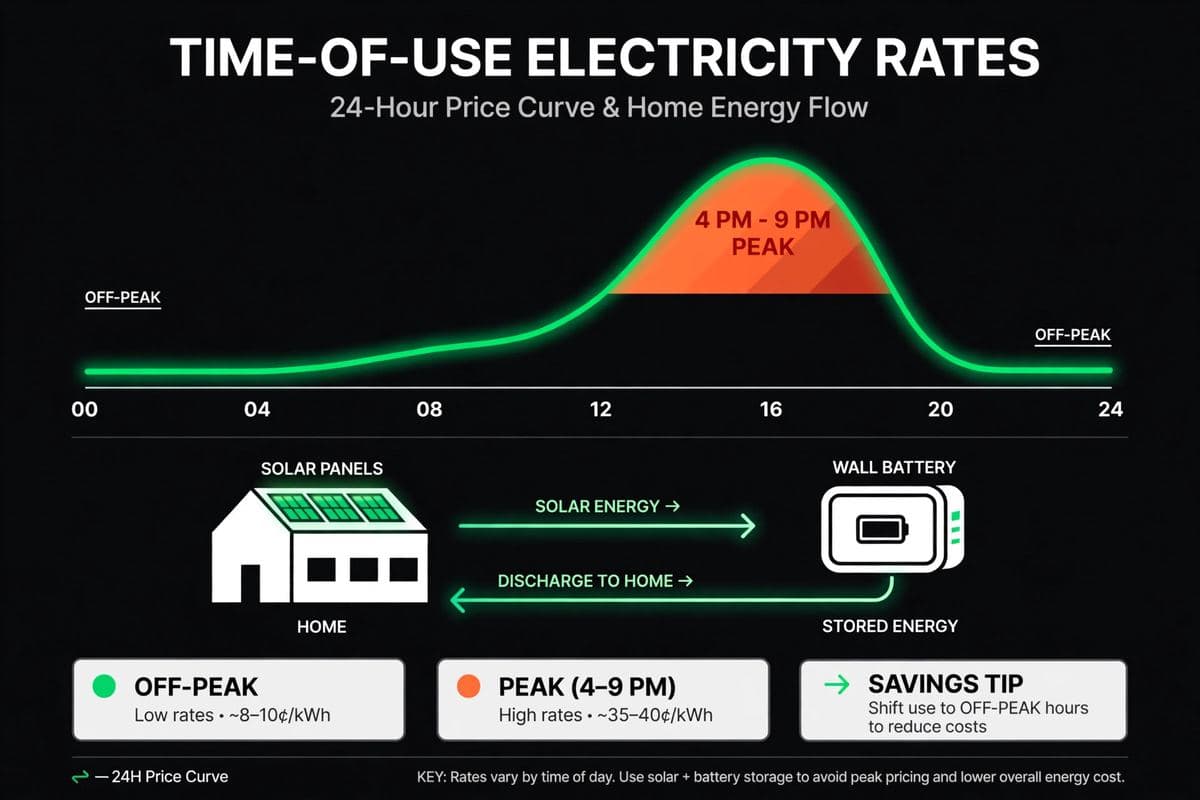
Batteries. Sizing panels for daytime production is one thing; using that energy at night is another. If outages or time-of-use rates are part of your calculus, size storage separately. Our home battery sizing guide covers how many kilowatt-hours of storage pairs with an 18-panel system.
Export value under net billing. California’s NEM 3.0 and similar net-billing regimes pay far less for exported surplus than for the electricity they replace. If your utility credits exports at a few cents per kWh, sizing to 100% of annual usage can be economically wrong even when the physics works: better to size to your daytime load and let the grid handle the rest. See our breakdown of whether solar is still worth it under NEM 3.0.
Run NREL PVWatts before you sign anything
Every number in this guide is a starting estimate. The definitive pre-purchase check is free and takes ten minutes: NREL’s PVWatts calculator, the federal lab’s tool that estimates a system’s annual production for your exact address using local weather data.
The workflow that experienced installers and DIYers use:
- Enter your property’s address or ZIP code at pvwatts.nrel.gov. The tool pulls the nearest weather station automatically.
- Input a DC system size in kW (start with your table value: 7.2 kW for a median state).
- Set module type to Premium for modern 400W-class panels, keep array type Fixed, and accept the auto-populated tilt, or match your actual roof pitch.
- Leave system losses at the 14% default unless you have reason to adjust (heavy shade, old wiring).
- Read the annual kWh output. Divide your actual annual usage by it, then scale the kW size, and panel count, proportionally.
If PVWatts says a 7.2 kW system on your roof produces 10,800 kWh, you need 18 panels, the table confirmed. If it says 9,000, you need 22. Run it, then cross-check installer quotes against it: a quality installer’s production estimate should land within about 10% of the PVWatts number, and any quote that ignores it is a quote from someone who hasn’t done the homework.
Frequently asked questions
How many solar panels does it take to power your home (and why)?
For the average US home: 14 to 27 400W panels, with 18 as the median. The spread exists because sunshine isn’t evenly distributed, a panel in the Southwest produces roughly twice the energy of one in Alaska, and because homes vary enormously in electricity use. Your bill, your roof, and your state’s sky set the answer.
How many of these panels? Starting with 10
Ten 400W panels make a 4 kW system that produces roughly 5,000–6,500 kWh per year in most states, about half of the average home’s 10,791 kWh. Ten panels fully power a home only if that home is small or extremely efficient (under ~500 kWh/month). For the average household, 10 panels cover roughly half the bill, not the whole thing.
Can I power my house with 10 solar panels?
Only if your annual usage is around 5,000–6,500 kWh: think efficient apartment or small home without electric heating or cooling. Compare: the EIA national average is 10,791 kWh. Check 12 months of bills first; if you’re under 550 kWh/month, 10 panels may genuinely cover you.
How many solar panels do I need for 30 kWh per day?
Thirty kWh per day is about 10,950 kWh per year, right at the national average. Expect 14 panels in the Southwest sun belt, 18 in most Midwest and Southeast states, and 21–27 in the cloudiest northern states. A 400W panel in an average-yield state produces roughly 590–680 kWh per year, so 16–19 panels is the most common answer.
Do more panels always mean lower electric bills?
No. Under net-metering regimes that credit exports at full retail, more production is almost always better. Under net-billing regimes like California’s NEM 3.0, surplus exports earn a fraction of retail rates, so oversizing past your daytime usage can have a very long payback. Size to your load and your tariff, not to your roof’s maximum capacity.