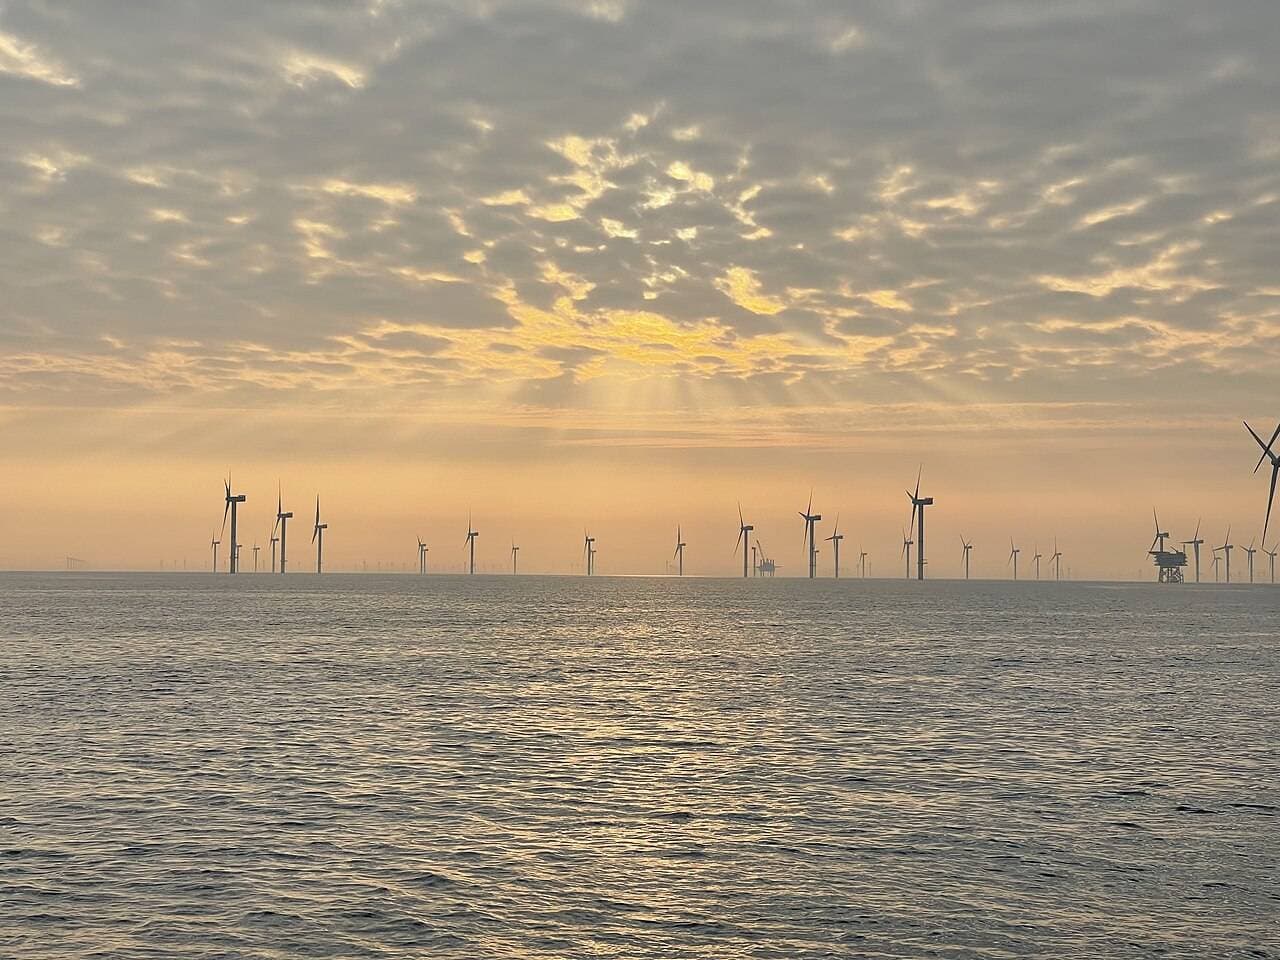
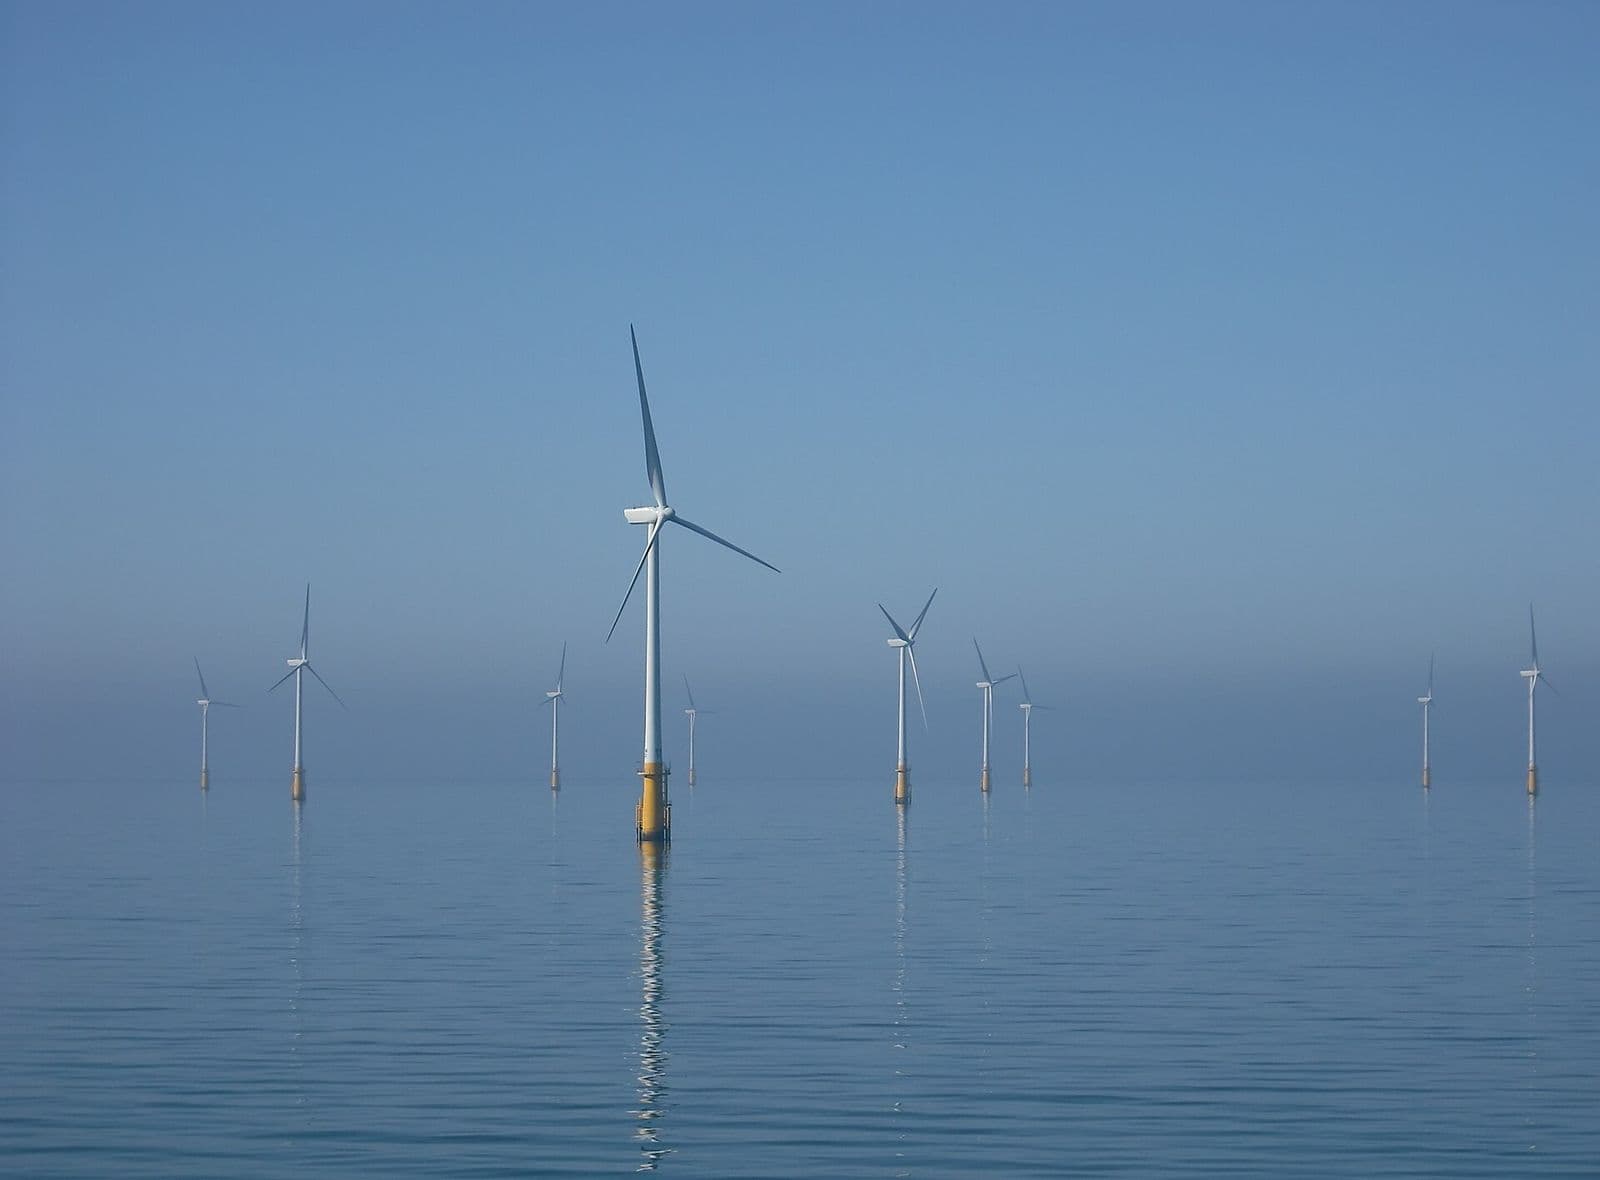
- Onshore wind generated power at USD 33 per megawatt-hour in 2025, against USD 78 for offshore wind, according to IRENA’s cost report for the year.
- Offshore turbines cost about three times as much to build per kilowatt, yet produce only 14% more electricity per megawatt over a year.
- Offshore wind still wins where land is scarce or grids are congested, because its output is steadier and its projects sit closer to coastal demand.
Levelised cost of electricity (LCOE): The average cost of generating one megawatt-hour over a plant’s whole life, counting construction, financing and maintenance, discounted to today’s money. It lets different technologies be compared on a single number.
The gap is a construction story before it is a wind story. Building one kilowatt of offshore capacity cost USD 2,931 in 2025, three times the USD 976 for onshore, and that steel, foundation and vessel bill is what keeps offshore power at USD 78 per megawatt-hour while onshore power sells at USD 33. The wind at sea is stronger, and the machines are bigger, but the extra energy they harvest covers only a fraction of the extra money they cost to put there.
IRENA’s Renewable Power Generation Costs in 2025, published in July 2026, puts the comparison on common ground: global weighted averages for projects commissioned in 2025, covering installed cost, capacity factor, maintenance and the resulting levelised cost. The onshore vs offshore wind contest is not close on price, and the report shows why the gap has narrowed only slowly.
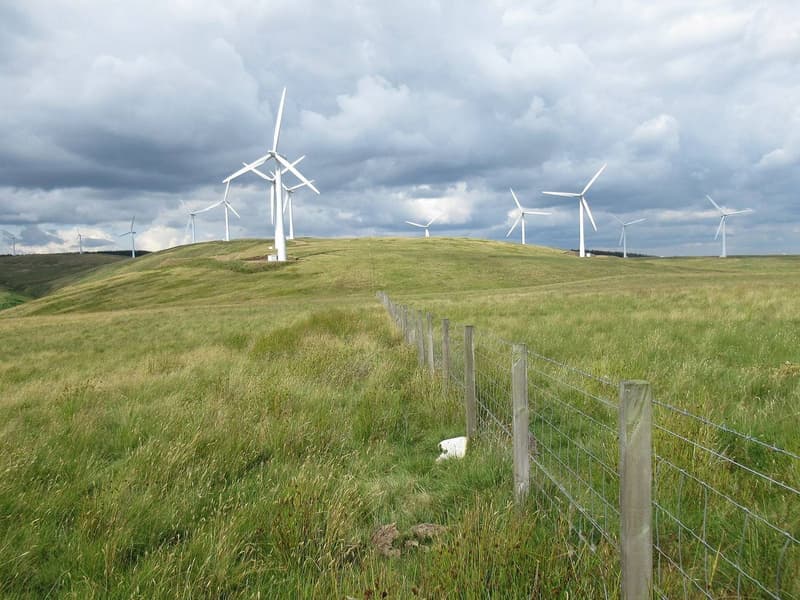
Onshore wind sets the price floor at $33 per megawatt-hour
Onshore wind remained the cheapest source of new electricity in 2025. Its global weighted-average LCOE fell 4% in a year to USD 33 per megawatt-hour, a 71% decline since 2010, and more than 90% of all newly commissioned utility-scale renewable capacity in 2025 came in below the cost of the cheapest new fossil-fuel alternative. Solar PV held at USD 44 per megawatt-hour, unchanged from 2024, while new gas-fired generation moved the other way, approaching USD 100 per megawatt-hour in high gas-cost markets such as Italy, Germany and Japan.
The onshore figure carries one large caveat. China accounted for most new renewable capacity in 2025 and benefits from a structural cost advantage, so excluding China lifts the global onshore average to USD 51 per megawatt-hour, 55% higher. Even that higher number undercuts offshore wind and most fossil alternatives. Between the 5th and 95th percentiles, onshore LCOE ranged from USD 21 to USD 80 per megawatt-hour in 2025, which means the cheapest onshore projects in strong wind regions produce power at a quarter of the offshore average.
Installed cost did most of the work. Onshore projects commissioned in 2025 averaged USD 976 per kilowatt, down 8% in a year and 59% below 2010. The range ran from USD 632 to USD 2,208 per kilowatt between the 5th and 95th percentiles, with China again pulling the average down. Onshore wind is a mature supply chain now: standardised turbines, truck transport, crane erection on prepared ground, and a competitive service market. Initial full-service maintenance contracts fell 76% between 2010 and 2025, and country-level maintenance costs in 2025 ran from USD 15 per kilowatt per year in India to USD 91 in Japan.
Offshore wind earns its $78 with steadier, stronger output
Offshore wind’s case rests on output. New offshore farms ran at a 41% global weighted-average capacity factor in 2025, against 36% onshore, and the range between the 5th and 95th percentiles was 35% to 49% offshore versus 28% to 50% onshore. Europe averaged 43% and North America 45%, while Asia sat at 40%. Germany recorded 46% and the United Kingdom 42%, with China at 39% and the Republic of Korea at 31%.
Translated into energy, the difference is concrete. A megawatt of onshore capacity at a 36% capacity factor generates about 3,154 megawatt-hours in a year; a megawatt offshore at 41% generates about 3,592 megawatt-hours. The offshore machine produces 438 megawatt-hours more per megawatt each year, 14% more energy from the same nameplate. Over a 25-year life that adds up to roughly 89,790 megawatt-hours offshore against 78,840 onshore, all from the same megawatt of capacity. (Joule Post arithmetic from the IRENA capacity factors, using 8,760 hours per year.)
Steadiness matters as much as volume. Offshore capacity factors have held at 41% to 42% for four years, while onshore factors move more with site quality: Africa averaged 43% in 2025 on projects in strong wind corridors such as Egypt’s Gulf of Suez, while Europe and Oceania averaged 34%. A grid operator buying offshore power gets a flatter, more predictable profile, and that predictability has a value the raw LCOE comparison does not capture.
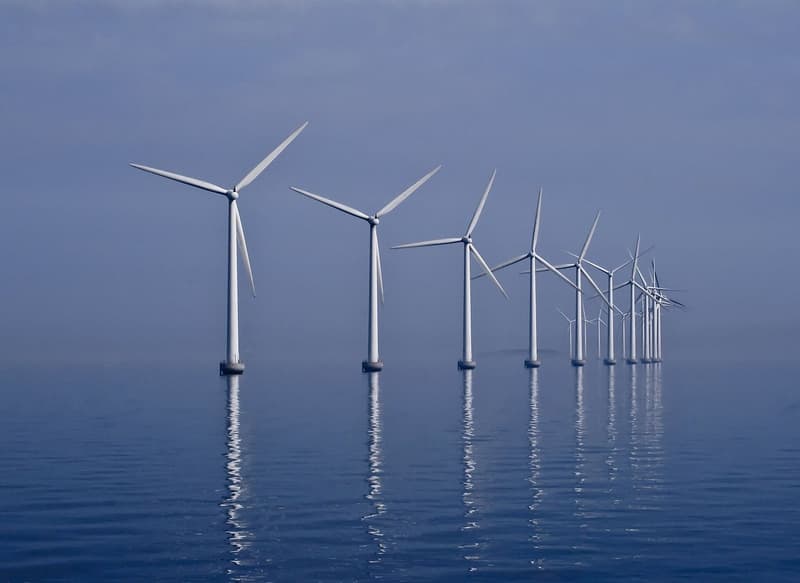
What the turbines cost: $976 against $2,931 per kilowatt
Offshore installed cost averaged USD 2,931 per kilowatt for 2025 commissions, down 48% since 2010 but essentially flat in the last year, falling only 0.3%. The range ran from USD 1,321 to USD 5,800 per kilowatt. Foundations, subsea cables, installation vessels and port infrastructure explain most of the premium: every component must survive salt water, be lifted from a ship, and be serviced by crews that can only reach the site in a weather window.
Put the two sides together and the price of the extra output becomes clear. Matching one offshore megawatt’s annual output takes about 1.14 megawatts of onshore capacity, which costs roughly USD 1,112 per kilowatt of offshore-equivalent output at the 2025 onshore price, against USD 2,931 for the offshore megawatt itself. Offshore capacity costs about 2.6 times as much per unit of annual energy delivered. (Joule Post arithmetic from the IRENA installed costs and capacity factors.) The LCOE ratio tells the same story in one number: USD 78 against USD 33, a gap of USD 45 per megawatt-hour.
Maintenance widens the gap further. Average fixed offshore maintenance cost was USD 100 per kilowatt per year in 2025, down from USD 111 in 2010, with a range of USD 76 to USD 122. At a 41% capacity factor that works out to roughly USD 28 of maintenance per megawatt-hour generated. Onshore maintenance varies so widely by country, USD 15 to USD 91 per kilowatt per year, that the per-megawatt-hour figure spans roughly USD 5 to USD 29 at a 36% capacity factor. (Joule Post arithmetic.) The sea charges a premium for every visit, and weather windows decide when visits happen.
| Metric (2025 commissions) | Onshore wind | Offshore wind |
|---|---|---|
| Levelised cost of electricity | USD 33/MWh | USD 78/MWh |
| LCOE change since 2010 | Down 71% | Down 63% |
| Total installed cost | USD 976/kW | USD 2,931/kW |
| Installed cost change since 2010 | Down 59% | Down 48% |
| Capacity factor | 36% | 41% |
| Capacity factor in 2010 | 27% | 38% |
| Fixed maintenance cost | USD 15–91/kW/yr by country | USD 100/kW/yr average |
Bigger machines, bigger farms: 10 MW turbines and 300 MW projects
Scale is offshore wind’s answer to its own cost problem. The weighted-average offshore turbine grew from 3.1 MW in 2010 to 10.3 MW in 2025, with Europe averaging 10.9 MW and the United Kingdom commissioning 13 MW machines for Dogger Bank. China has deployed offshore turbines of up to 16 MW. Fewer, larger machines mean fewer foundations, fewer cable connections and fewer vessel trips per megawatt, and average project size reached 312 MW in 2025, with Europe at 394 MW and China at 284 MW, and several projects passing 1 GW.
Onshore turbines have grown too, but the constraint there is transport: blades and tower sections must travel by road to sites that are often far from ports. Offshore projects load components at quayside and sail them out, which is why the offshore fleet could scale to 10 MW averages while onshore machines stayed smaller. The cost report does not publish a 2025 onshore average turbine rating, so the comparison rests on the offshore numbers alone.
The growth has not yet closed the cost gap. Offshore installed cost fell only 0.3% between 2024 and 2025 and has been roughly stable for three years, while onshore fell 8% in the same year. IRENA expects renewable costs to keep falling to 2035, but at a slower pace than the last decade, with clean-technology manufacturing investment roughly halved since its 2023 peak and commodity prices and trade frictions pushing the other way. The binding constraint in many markets is now the cost of capital rather than the technology.
When offshore wins anyway: dense coasts and crowded grids
Price alone would end the contest onshore, yet offshore deployment keeps growing, because the decision is rarely price alone. Coastal demand centres in Europe and East Asia have little open land for onshore turbines and face planning limits, while the sea beside them holds a stronger resource. An offshore farm can sit 20 km from a city that needs the power, feeding it through a short subsea cable instead of a long onshore transmission line. Joule Post’s guide to how wind turbines work sets out the machine-level reasons bigger rotors at sea capture more energy, and the offshore turbine lifespan guide covers what happens when those machines reach the end of their 25-year design life.
Grid value also tilts the balance. Offshore output correlates less with onshore wind lulls in some markets, and large single projects connect at transmission voltage with fewer consenting battles than dozens of small onshore sites. The United Kingdom’s Dogger Bank, where 13 MW turbines are being installed, shows the model: one project, gigawatt scale, feeding a national grid from the North Sea. Read the Dogger Bank construction update and the Five Estuaries stake sale for how developers are financing that scale.
Storage changes the arithmetic for both. A four-hour utility battery cost about USD 140 per kilowatt-hour installed in 2025, down close to 30% in a year and 95% below 2010, and around a quarter of new utility-scale solar was paired with storage. Firm solar-plus-battery systems at high-quality sites now deliver power below USD 85 per megawatt-hour. The same pairing logic applies to wind: the technology that wins the next decade may be the one that pairs cheapest with storage, and onshore wind plus batteries starts that race USD 45 per megawatt-hour ahead. See how grid batteries work for the storage side of that equation.
The verdict from the 2025 numbers is plain. Onshore wind is the cheapest new power on the planet, and offshore wind is the most expensive renewable in the comparison, yet offshore keeps being built because it solves problems onshore cannot: land scarcity, planning friction and coastal demand. The USD 45 gap is the price of those solutions, and it is narrowing only slowly.
Frequently asked questions
Is offshore wind more efficient than onshore wind?
Offshore turbines produce more electricity per megawatt: a 41% capacity factor in 2025 against 36% onshore, according to IRENA. The extra output is real but modest, about 14% more energy per megawatt per year, and it does not offset the roughly threefold build cost.
Why is offshore wind so expensive?
Foundations, subsea cables, installation vessels and marine maintenance drive the premium. Offshore installed cost averaged USD 2,931 per kilowatt in 2025, against USD 976 onshore, and fixed maintenance averaged USD 100 per kilowatt per year, with weather windows limiting when crews can work.
Which is better, onshore or offshore wind?
Onshore wins on cost: USD 33 per megawatt-hour against USD 78 offshore. Offshore wins where land is scarce, planning is constrained, or demand sits on the coast, and where steadier output carries grid value. The right choice depends on the site and the grid.
How much does an offshore wind turbine cost?
At the 2025 average installed cost of USD 2,931 per kilowatt, a single 10.3 MW offshore turbine represents about USD 30 million of project cost before financing, using the IRENA average turbine rating and installed cost. Individual projects vary widely, from USD 1,321 to USD 5,800 per kilowatt.
Sources
- IRENA, Renewable Power Generation Costs in 2025 — IRENA, July 2026 (report PDF)
- IRENA, Renewable Power Generation Costs in 2025 — Energypedia publication record, July 2026
- IRENA press release: USD 480 billion fossil-fuel costs avoided by renewable energy boom in 2025 — IRENA, 2 July 2026