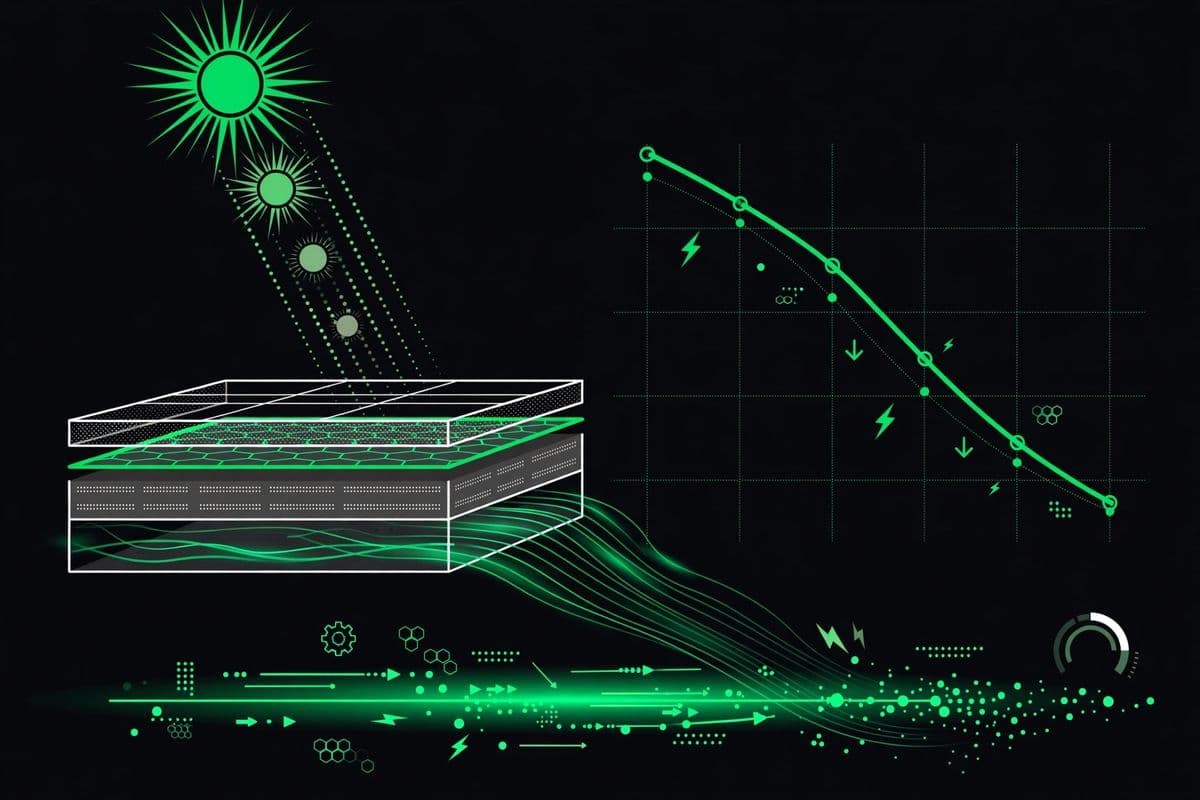
- The solar panel degradation rate most often cited for crystalline silicon is a median of about 0.5% per year, from the NREL review by Jordan and Kurtz.
- A larger first-year light-induced drop comes first, and it has a different cause from the slow annual fade that follows.
- Warranty floors sit below typical field performance, so a panel can meet its warranty and still lose output faster than the median.
Solar panel degradation rate: the annual decline in a panel’s maximum power output, measured against its nameplate rating under standard test conditions, caused by light, heat, moisture and mechanical stress during years of outdoor exposure.
A warranty floor and a field measurement answer different questions. A warranty states the lowest output a manufacturer will stand behind at a stated age. A field measurement states the output a large sample of installed panels delivered on average. Homeowners who read only the warranty sheet can conclude that panels are guaranteed to fade to that floor. Field data point in a calmer direction, with most panels holding output above the floor for the full warranty term and continuing to produce power long after it ends.
The distinction matters when a system underperforms in year eight or year twelve. A panel producing less than its warranty floor may qualify for a claim. A panel producing less than its neighbours while staying above the floor points toward soiling, shading, an inverter fault or a single failed module, and the fix sits in monitoring and inspection rather than in paperwork. The solar panel degradation rate gives owners a yardstick for that judgment, provided the yardstick is applied to weather-corrected output over months.
Light-induced degradation and the first-year drop
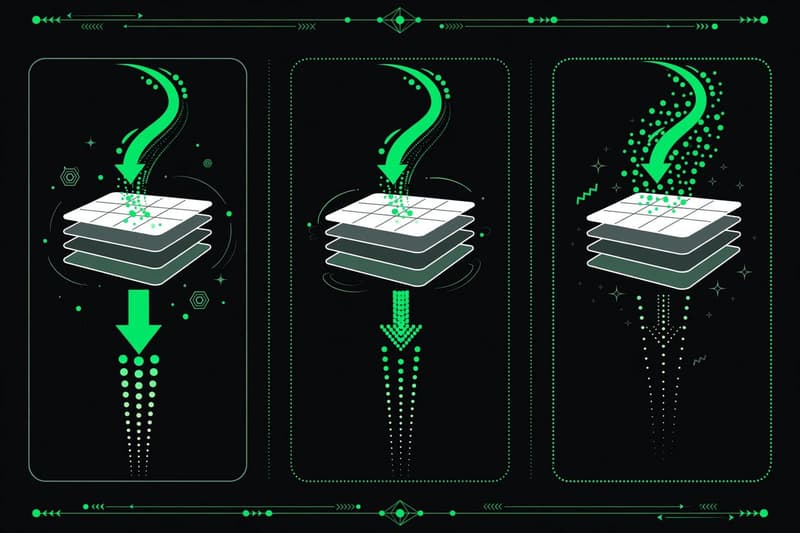
Panels lose a measurable share of output during their first exposure to sunlight. The mechanism, called light-induced degradation, involves boron and oxygen in p-type silicon forming complexes under illumination. Those complexes trap charge carriers that would otherwise reach the contacts, and output falls within hours or days of first sunlight. The drop then stabilises. It does not repeat every year at the same size, and it does not signal a defective panel in most cases.
The size of the first-year drop varies with cell type. Boron-doped p-type cells show the effect most clearly. Gallium-doped p-type cells and n-type cells, which use phosphorus doping, show far less of it, because the boron-oxygen complex cannot form in the same way. Manufacturers account for the effect in warranty schedules by setting a larger first-year allowance, commonly in the range of 1% to 3%, followed by a smaller annual allowance. A buyer comparing two datasheets should read the first-year line and the annual line together. A panel with a small annual rate and a large first-year allowance can end year 25 below a panel with a slightly larger annual rate and a small first-year allowance.
Light-induced degradation also explains why a brand new system can appear to disappoint in its first month. Production in the first weeks reflects the post-drop output, while the nameplate rating reflects the pre-drop laboratory measurement. Installers who set expectations around the first month of monitoring data, with weather correction, give owners a steadier baseline than installers who quote nameplate figures as if they were a promise for every sunny day.
The solar panel degradation rate median in the NREL field review
The figure most often quoted for the solar panel degradation rate comes from a review by Dirk Jordan and Sarah Kurtz at the National Renewable Energy Laboratory, covering nearly 2,000 systems. The review reported a median degradation rate of about 0.5% per year for photovoltaic modules. NREL later used an assumed degradation rate of 0.5% per year in its Annual Technology Baseline capacity factor calculations, citing Jordan and Kurtz 2013. A median describes the middle system in a large sample. Half of the systems in the review faded faster, and half faded slower. It is a planning figure for a fleet, and a single rooftop can sit well away from it.
Later field work added texture without overturning the headline. Systems installed after 2000 generally faded more slowly than older systems, reflecting better encapsulation, better cell processing and tighter quality control. Hot and high-ultraviolet climates faded faster than temperate climates, because heat accelerates chemical processes inside the module and ultraviolet light attacks encapsulant and backsheets. The spread matters for buyers in Phoenix and Miami, where the same panel model can age measurably faster than an identical panel in Seattle or Portland, even with identical maintenance.
Reporting in pv-magazine USA, summarising NREL, put the same benchmark in homeowner terms: at about 0.5% per year, a 20-year-old panel remains capable of producing about 90% of its original capability. Premium makers reported rates near 0.3% per year in that reporting, while some brands reached 0.80% per year. The gap between 0.3% and 0.8% looks small on a datasheet. Compounded over 25 years, it separates a panel holding more than 90% of its output from a panel holding closer to 80%.
PERC, TOPCon and HJT fade at different speeds
Cell technology sets the starting point for degradation. PERC cells, the p-type workhorse of the late 2010s and early 2020s, carry the boron-oxygen mechanism and the larger first-year drop that comes with it. TOPCon cells use n-type silicon, which removes that mechanism and generally carries a smaller first-year allowance and a lower annual rate in manufacturer warranty schedules. Heterojunction cells also use n-type wafers, add amorphous silicon layers for surface passivation, and generally sit at the low end of published annual rates, with strong temperature performance as an added benefit.
Technology alone does not decide the outcome. Encapsulant quality, backsheet durability, cell cracking during transport and installation, and the quality of electrical connections all feed into the measured rate. A premium TOPCon panel installed with cracked cells can fade faster than a mid-range PERC panel installed carefully. Buyers get more protection from a maker with a long field record and a warranty backed by a balance sheet than from a fractional difference in a datasheet annual rate, because the datasheet rate describes a population and the warranty describes the remedy available to one owner.
Thin-film panels follow a different pattern. Cadmium telluride panels, the technology First Solar uses at utility scale, show a larger early stabilisation drop followed by a steady annual rate broadly comparable to crystalline silicon. Their degradation story is inseparable from their temperature behaviour, since thin-film modules lose less output per degree of heat than crystalline silicon modules. For a detailed account of how panels convert sunlight in the first place, see How Solar Panels Work.
Potential-induced degradation and other failure modes
Potential-induced degradation, known as PID, affects some systems and spares others entirely. High system voltage drives leakage currents through the module, and sodium ions can migrate to cell surfaces, shunting power away. PID shows up as a sharp output drop in part of a string, often in systems with transformerless inverters and high string voltages, and it can be partly reversible with the right equipment. Modern modules carry PID resistance ratings under IEC 62804 testing, and installers can reduce risk by keeping string voltages within design limits and by choosing modules tested for the intended system voltage.
Other mechanisms act more slowly. Moisture ingress corrodes cell interconnects and can delaminate encapsulant. Thermal cycling, the daily expansion and contraction of glass, cells and frames, stresses solder joints and can open microcracks. Ultraviolet exposure yellows encapsulant, cutting the light that reaches the cells. Hail, wind loading and poor handling add mechanical damage that accelerates every other mechanism. None of these mechanisms announces itself with a single dramatic failure. They accumulate, and the monitoring record shows them as a gradual slope with occasional steps after storms or heat waves.
Soiling sits apart from true degradation because cleaning can reverse it. Dust, pollen, bird droppings and snow block light without damaging the cell. A soiled panel that reads low in summer can read normally after rain or cleaning, while a degraded panel reads low in clean conditions too. Owners who compare output before and after cleaning, with the same sun angle and temperature, can separate the two effects without any specialist equipment beyond the monitoring portal the inverter already provides.
What a 0.5% rate compounds to over 30 years
Compounding turns a small annual rate into a large lifetime difference. The table below applies stated assumptions to a 400-watt panel: a 2% first-year light-induced drop, then 0.5% per year. The figures are Joule Post arithmetic from those assumptions. They show retained output as a share of the nameplate rating, which is the comparison a warranty schedule uses.
| Year | Retained output | 400-watt panel output |
|---|---|---|
| 1 | 98.0% | 392 watts |
| 5 | 96.1% | 384 watts |
| 10 | 93.7% | 375 watts |
| 15 | 91.4% | 366 watts |
| 20 | 89.1% | 356 watts |
| 25 | 86.9% | 348 watts |
| 30 | 84.7% | 339 watts |
The same arithmetic at 0.3% per year, with the same 2% first-year drop, leaves a panel at about 91% in year 25. At 0.8% per year, the panel sits near 81% in year 25. That 10-point spread is the financial prize for choosing a low-degradation maker, and it grows with system size. On a 20-panel array, 10 points of retained output equal the output of two full panels in year 25, produced every sunny day without buying anything extra. For the warranty paperwork that governs those numbers, see our guide to the 25-year solar panel warranty, which separates product, performance and workmanship coverage.
Degradation also shifts the payback calculation in a way that simple models miss. A model that holds year-one production flat for 25 years overstates lifetime energy by roughly the area between the flat line and the declining curve, about 6% to 7% of total energy under the assumptions above. Installers who include degradation in production estimates, using tools such as NREL PVWatts, give owners a payback date that survives contact with year-ten monitoring data. Installers who omit it hand owners a pleasant first-year surprise followed by a slow disappointment that looks like a fault.
How to tell fading from a fault
Start with weather correction. Compare the same month across years, using irradiance data from the monitoring portal or a nearby weather station, rather than comparing a sunny June with a cloudy June. A single string that falls while neighbouring strings hold steady points to a string-level problem, such as a failed optimiser, a damaged connector or PID. A whole array that falls evenly, in line with the expected annual rate, points to normal fading or uniform soiling.
Check the inverter record next. Inverters typically need replacement once during a panel lifetime, and a failing inverter can mimic panel degradation by clipping output or dropping production on hot afternoons. Panel-level monitoring, through microinverters or DC optimisers, narrows the search to individual modules. String-level monitoring can only narrow it to a group of panels, which is enough to justify a site visit but not enough to name the faulty module.
Thermal imaging, offered by many solar service firms, reveals hot spots where cracked cells or failed connections dissipate power as heat. A hot spot on one cell, with the rest of the module at normal temperature, is a defect signature. Uniform warmth across a module, with output tracking the expected fade, is an ageing signature. The distinction decides whether the remedy is a warranty claim, a single module replacement, or acceptance of a normal slope.
Owners should also record the baseline. A commissioning report with the output measured on a clear day, corrected for temperature and irradiance, gives every later comparison a fixed anchor. Without a baseline, a year-twelve argument about degradation becomes a contest of memories. With one, it becomes arithmetic, and arithmetic settles most warranty conversations before they reach a formal claim.
Frequently asked questions
How much do solar panels degrade per year?
The median rate in the NREL review by Jordan and Kurtz is about 0.5% per year for photovoltaic modules. Premium panels report rates near 0.3% per year, and some brands reach 0.8% per year, so treat the median as a planning figure for a fleet.
How do I know how much my solar panels have degraded?
Compare weather-corrected output for the same month across years, using the inverter monitoring portal. A steady, even decline near the expected annual rate points to normal fading. A sudden drop in one string, or a drop that cleaning reverses, points to a fault or soiling instead.
Do solar panels lose efficiency over time?
Yes. Output declines gradually as light, heat and moisture act on cells, encapsulant and connections. Panels do not stop working at a fixed age. A 25-year-old panel typically still produces most of its original output, and the decision to replace it usually turns on economics, roof work or inverter replacement rather than a sudden failure.
Does heat make degradation worse?
Heat accelerates the chemical processes behind degradation and also cuts instantaneous output through the temperature coefficient, which is a separate effect. Panels in hot, high-ultraviolet climates fade faster than identical panels in temperate climates, which is why field studies report a range of rates rather than a single universal figure.
Is degradation covered by warranty?
Performance warranties cover output falling below a stated floor at a stated age, commonly at least 80% after 25 years, with terms that vary by maker and model. Product warranties cover defects and materials failures over a shorter term. A panel fading at the median rate stays above most floors, so normal fading rarely triggers a claim.
Sources: