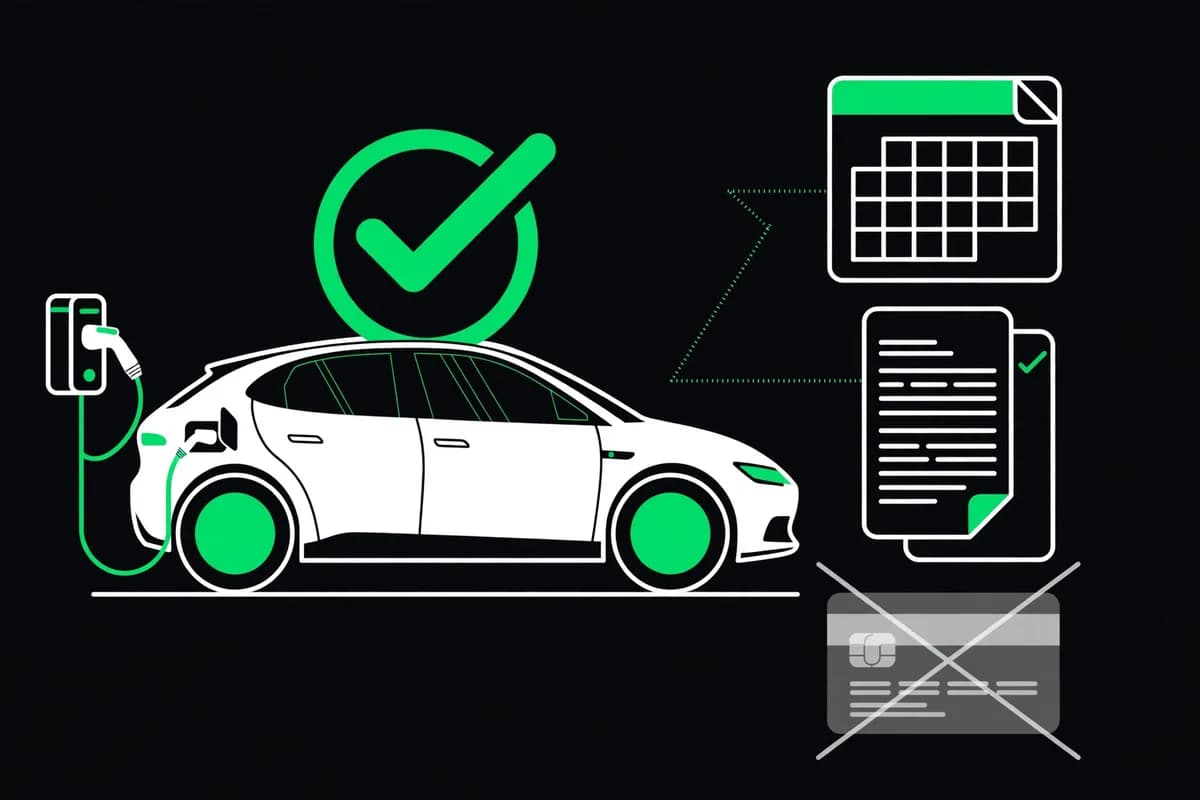
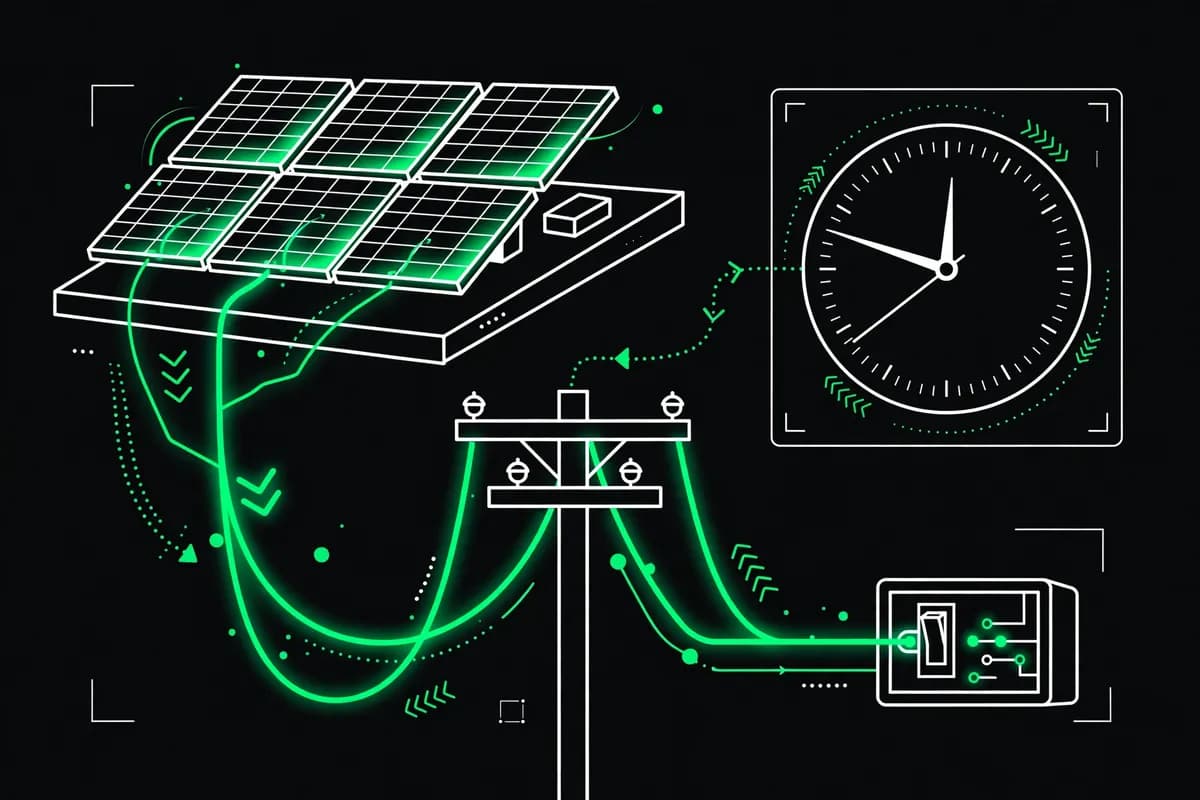
- U.S. data from the National Renewable Energy Laboratory, published in 2015, puts the average wait from interconnection application to permission to operate at 63 business days, with a median of 53 days.
- Physical construction is the fastest step, averaging 4 business days, while application review alone averages 27 business days.
- The wait splits across two separate approvals, a city building permit and a utility permission to operate, and a delay in either one holds up switch-on.
Permission to operate (PTO): The written authorization from the local utility that a solar system may be switched on and connected to the grid, issued after inspection and a final grid-safety check.
Homeowners usually picture the wait for solar as the wait for an installation crew. The national data reverses that picture. Crews finish the physical work in days, and paperwork then decides when the system earns its first credit. Two approvals sit between a signed contract and a live system, and neither one is controlled by the installer who sold the job. One belongs to the city or county building department, and the other belongs to the utility that owns the wires outside the house.
Understanding which clock is running matters because each clock has a different owner, a different application, and a different way to stall. The building permit confirms the design meets electrical and structural codes. The interconnection application confirms the local grid can accept the system’s output safely. A system can hold a valid building permit and still wait weeks for utility authorization, and it can hold utility approval in principle and still wait for a final inspection. The homeowner pays for the system during that gap and receives no generation credit until both approvals clear.
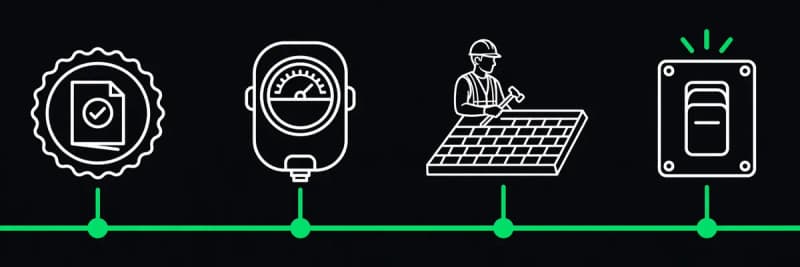
63 business days, measured across 30,000 systems
The National Renewable Energy Laboratory examined more than 30,000 residential and small commercial systems under 50 kilowatts across 87 utility territories and 16 states, in a study published in 2015. It remains the detailed national breakdown of where the time goes, and it predates the SolarAPP+ permitting rollout described below, so permit-track times in adopting jurisdictions should now be shorter. From the date an installer submitted an interconnection application to the date the utility granted permission to operate, the average total was 63 business days and the median was 53 business days. The range ran from less than one week to more than six months, which means the average hides wide local variation. A household in a fast jurisdiction can switch on in days, while a household in a slow one can wait a full season.
Construction barely registers in that total. The laboratory found system construction averaged 4 business days, with a median of 2 days. Interconnection application review and approval took the most time of any single step examined, averaging 27 business days with a median of 18 days. In other words, review alone consumed about 43 percent of the 63-day average, while construction consumed about 6 percent. The remaining time sat in inspections, final authorization, and the gaps between steps, where an application waits in a queue rather than moving through active work.
| Step | Average | Median | Share of 63-day average |
|---|---|---|---|
| Interconnection application review and approval | 27 business days | 18 business days | 43 percent |
| System construction | 4 business days | 2 business days | 6 percent |
| All other steps, inspections, and waiting time | 32 business days | 33 business days | 51 percent |
| Total, application to permission to operate | 63 business days | 53 business days | 100 percent |
The table uses the laboratory’s published averages and medians, with the residual row and percentages calculated by Joule Post from those figures. Business days convert to calendar time at roughly five business days per seven calendar days, so 63 business days span about 12 to 13 calendar weeks and 53 business days span about 10 to 11 weeks. States with stricter interconnection timeframe rules tended to show shorter overall project lengths in the laboratory’s state-level findings, but the rules did not necessarily hold timelines to the targets written in interconnection standards. A deadline on paper and a deadline met in practice are different outcomes.
Two clocks that run on different tracks
The building permit track starts with design documents: a site plan, structural calculations, an electrical diagram, and equipment specifications. The local authority having jurisdiction reviews the package against the National Electrical Code, the International Building Code, fire safety rules, and local zoning. Incomplete applications cause many of the delays on this track, because a missing calculation or an incorrect diagram sends the package back for correction and a fresh place in the queue. Installers who submit complete packages on the first attempt remove the most common avoidable delay on the permit side.
The utility track starts with its own interconnection application, which asks how much power the system will export and where it connects. The utility checks whether the local transformer and feeder can absorb that output without voltage or safety problems. Most residential systems pass on standard review, but systems on constrained feeders, systems paired with large batteries, or systems in areas with many existing installations can trigger a deeper study. That study adds weeks and can require grid upgrades, equipment changes, or a smaller approved system size. The utility track ends with permission to operate, which is the only authorization that allows the system to export power legally.
Sequencing adds a third source of delay. Some jurisdictions allow the permit and interconnection applications to run in parallel, while others require one approval before the next step can start. Inspection sits between the two tracks in many places: the building department inspects the installed system, the utility may require its own meter work or inspection, and permission to operate follows only after both inspections pass. A failed inspection restarts part of the sequence. Homeowners should ask their installer, in writing, which applications have been filed, on what dates, and which approvals are still outstanding, because the contract signing date is not the date either clock starts.
Germany cut one approval from 12 days to 5 minutes
Germany’s experience shows how much of the wait is administrative rather than technical. Distribution system operator Netze BW introduced an automated grid assessment process for rooftop systems up to 15 kilowatts that can issue binding grid connection approvals in five minutes, down from an average of 12 days for manual assessment, where sufficient grid capacity is available. The company launched the system in late July 2026 after testing that began in November 2025, and it had received more than 16,000 grid connection requests for small-scale installations since then. More than 5,000 applicants had already received automated responses within five minutes, and the company states those responses are binding approvals that specify the connection point.
The German contrast carries two limits that matter for U.S. readers. First, automation covers only areas where grid capacity is not considered critical. Where the digital grid model finds insufficient capacity, the application goes to manual review, which can take up to 12 days, and systems larger than 15 kilowatts still require manual assessment. Second, the German median across all operators was 80 days for manually assessed requests in a comparison published by the federal regulator, against Netze BW’s own 12-day manual average, so automation improves a process that already varied sharply by operator. The lesson for the United States is narrower than a five-minute promise: standard cases with adequate grid capacity can be decided by software, while constrained cases still need engineering judgment and time.
U.S. automation exists in a different form. The National Renewable Energy Laboratory’s SolarAPP+ platform automates residential rooftop permitting checks for code compliance and can issue permits instantly for qualifying systems, cutting the permitting process by 5 to 10 business days according to the laboratory. SolarAPP+ addresses the building permit track only. The utility permission track stays untouched. A jurisdiction that adopts SolarAPP+ can still leave a homeowner waiting on utility review, which the laboratory’s data identifies as the longest single step.
What each month of waiting costs a household
A delay costs generation, and generation has a price. Take an 8 kilowatt rooftop system producing 1,400 kilowatt-hours per kilowatt per year, a stated assumption for this illustration. Annual production is 11,200 kilowatt-hours, or about 30.7 kilowatt-hours per day. At a retail electricity price of 17 cents per kilowatt-hour, also stated as an assumption, each day of waiting forgoes about $5.22 of electricity value. A 30-day delay forgoes about $157. A 74-day calendar wait, the calendar equivalent of the 53-day median, forgoes about $386 if the system would otherwise have been generating from day one.
Those figures overstate the loss in one respect and understate it in another. They overstate it because a system installed in winter produces less per day than the annual average, and because export credits under net billing rules can be worth less than the retail rate. They understate it because the household keeps paying loan or lease costs during the wait, and because a delay that pushes switch-on past a net metering deadline or an incentive change can cost more than the generation alone. Homeowners in states weighing post-NEM 3.0 rules in California should treat the permission date as the date that fixes their tariff treatment, rather than the contract date, and should confirm that date in writing with the installer.
| Waiting time after install | Generation forgone at stated assumptions | Value at 17 cents per kWh |
|---|---|---|
| 14 days | 430 kWh | $73 |
| 30 days | 921 kWh | $157 |
| 53 business days (about 74 calendar days) | 2,272 kWh | $386 |
| 63 business days (about 88 calendar days) | 2,702 kWh | $459 |
The table is Joule Post’s calculation from the stated assumptions: an 8 kilowatt system, 1,400 kilowatt-hours per kilowatt per year, and 17 cents per kilowatt-hour. Actual production varies with location, roof orientation, shading, and season, and actual credit value depends on the household’s tariff. The point of the arithmetic is scale. Precision would require local production and tariff data. A wait measured in business days is a wait measured in hundreds of dollars, which is why chasing the status of both approvals is worth the homeowner’s time even after the crew has left.
How to shorten a timeline you do not control
Homeowners control three things: the completeness of the information they supply, the choice of installer, and the questions they ask during the wait. Supplying accurate roof, electrical panel, and usage information at contract signing prevents the application corrections that restart queues. Choosing an installer with recent work in the same jurisdiction matters, because local experience shows up as familiarity with the building department’s checklist and the utility’s portal. Asking for filing dates, approval dates, and inspection dates in writing creates a record that separates installer delay from authority delay when a timeline slips.
Two questions deserve answers before signing. Ask whether the installer files the building permit and the interconnection application in parallel or in sequence, and ask what happens if the utility requires a grid study or an equipment upgrade. The answers reveal whether the quoted timeline assumes a standard case or has room for the constrained case that the laboratory’s data shows is common. A timeline quoted in weeks from contract signing, with no mention of either approval, is a sales figure rather than a schedule. A timeline quoted as business days from application filing, split by permit and utility tracks, is the figure a homeowner can hold someone to. For the system itself, how panels convert sunlight matters less during the wait than which office holds the next signature, and the signature is the schedule.
Frequently asked questions
How long does solar interconnection take?
National laboratory data published in 2015 puts the average at 63 business days and the median at 53 business days from interconnection application to permission to operate, for residential and small commercial systems under 50 kilowatts. Local timelines range from under a week to more than six months, and permit-track times in SolarAPP+ jurisdictions should be shorter today.
How long does a solar permit take?
Building permit review varies by jurisdiction. Automated permitting through SolarAPP+ can cut 5 to 10 business days from the permitting process for qualifying residential systems, according to the National Renewable Energy Laboratory. Manual review in a busy jurisdiction can take several weeks.
Can solar panels be installed before permission to operate?
Yes, in most cases the physical installation happens before permission to operate is granted. The system must stay switched off, or at least must not export power to the grid, until the utility issues permission to operate after inspection.
What is permission to operate for solar?
Permission to operate is the utility’s written authorization to switch a solar system on and connect it to the grid. It follows inspection and a final grid-safety check, and it is the last approval before the system can generate bill credits.
Why do solar installs take so long to switch on?
Construction is fast, averaging 4 business days in national laboratory data. Application review, inspections, and waiting between steps take the remaining time. The two separate approvals, a city building permit and a utility permission to operate, each carry their own queue.