- This used EV battery health check starts with fleet data: average EV battery degradation runs at 2.3 percent per year in Geotab’s 2026 analysis of about 22,700 EVs, projecting 81.6 percent capacity after 8 years.
- Frequent high-power DC fast charging degrades packs faster than AC-primary charging, at up to about 3.0 percent per year versus about 1.5 percent.
- Check SoH with a scan tool, cross-check the dashboard gauge, verify recalls by VIN, and use the SoH bands in this article to set the price.
State of health (SoH): State of health is the share of an electric vehicle battery’s original usable capacity that remains after use and ageing. A reading of 85 percent means the pack can store about 85 percent of the energy it held when new, which directly reduces driving range.
Replacement packs cost more than any other single component, and degradation follows calendar age and charging history as much as mileage — which is why a low-odometer car can still carry a tired pack, and why dashboard range alone misleads. The checks below separate genuine capacity loss from display quirks, and show which results should end the deal or send you to a specialist inspection.
Range alone is a weak test. A dashboard range estimate changes with driving style, temperature, and recent trips, and a seller can present the car after a gentle, slow charge. A SoH reading, a dashboard capacity gauge where fitted, and a check of charging history give a firmer picture. Together, those checks show whether the car will still meet daily driving needs in two or three years, rather than only on the day of purchase.
Used EV battery health check: what SoH measures
EV battery state of health is usually expressed as a percentage of original capacity. A new pack sits near 100 percent. A pack at 85 percent stores about 85 percent of its original usable energy, so a car rated at 300 miles when new would deliver about 255 miles at that SoH, before temperature and driving style are considered. SoH is therefore a capacity measure, rather than a fault code or a single charge reading.
Degradation is normal, but the rate varies widely. According to the Geotab analysis of EV battery degradation, average degradation across about 22,700 EVs reached 2.3 percent per year in 2026, up from 1.8 percent in 2024. Geotab projects 81.6 percent capacity after 8 years at that average rate. That 81.6 percent is the linear projection at 2.3 percent per year (100 minus 2.3 times 8); compounding the same annual rate would give about 83 percent. Charging habits explain much of the spread around that average.
| Use pattern | Annual degradation | What it means for a buyer |
|---|---|---|
| Average across Geotab sample | 2.3 percent per year | Projected 81.6 percent capacity after 8 years |
| AC-primary charging | About 1.5 percent per year | Slower loss, better long-term range |
| Frequent DC fast charging above 100 kW in more than 12 percent of sessions | Up to about 3.0 percent per year | Faster loss, check SoH against age carefully |
| Best modern models | As low as 1.0 percent per year | Age alone is a poor proxy for condition |
Replacement risk is lower than many buyers fear. A secondary summary of Geotab data reports that only 2.5 percent of EVs ever needed battery replacement, and 0.3 percent for Gen-3 vehicles from 2022 onward. Those figures are reported summaries of the dataset, rather than a direct Geotab quotation. The practical risk for most buyers is reduced range and reduced value, rather than sudden pack failure. For wider context on pack life, see how long EV batteries last according to 2026 data.
Nissan Leaf: the checks that matter most
The Nissan Leaf needs extra care because its pack is passively air-cooled, with no liquid thermal management. Heat therefore affects Leaf packs more than liquid-cooled rivals, and hot-climate cars deserve closer scrutiny. The dashboard carries a 12-bar capacity gauge, which gives a rough visual check, but the bars are coarse, so a scan reading should confirm what the gauge suggests.
Pack size changed across model years. Early cars from 2011 to 2015 used a 24 kWh pack, 2016 to 2017 cars used a 30 kWh pack, 2018 and later cars used a 40 kWh pack, and Plus models from 2019 onward used a 62 kWh pack. The 2015 and later “lizard” chemistry tolerates heat better than earlier chemistry. The 30 kWh pack is known for degradation, so a 2016 or 2017 car needs a particularly careful SoH reading. According to the Recurrent guide to the Nissan Leaf, Leaf range after 3 years averaged 93 percent of original, and after 5 years averaged 91 percent.
| Leaf model years | Pack size | Buyer note |
|---|---|---|
| 2011 to 2015 | 24 kWh | Early chemistry, check heat history and SoH |
| 2016 to 2017 | 30 kWh | Known degradation risk, scan reading essential |
| 2018 onward | 40 kWh | Rapidgate throttling can limit repeated fast charging |
| 2019 onward, Plus | 62 kWh | Larger pack, still air-cooled, check SoH and fast-charge needs |
Charging hardware is a further Leaf limit. The CHAdeMO port is orphaned in North America, so public fast charging is harder to rely on than for CCS cars, and a Leaf suits home charging best. Cars from 2018 onward can also suffer Rapidgate throttling, where repeated fast charging slows charging speeds. A buyer who plans regular road trips should test that use case honestly, rather than assuming fast charging will match a liquid-cooled rival. For home charging, see whether a 120-volt outlet is enough for EV charging.
Recalls need a VIN check before purchase. Recalls cover the backup camera on 2018 to 2022 cars, and brake-tube corrosion on certain 2023 cars. Verify recall status through the VIN, and confirm any required work is complete, rather than relying on a seller assurance.
How LeafSpy and an OBD-II dongle reveal SoH
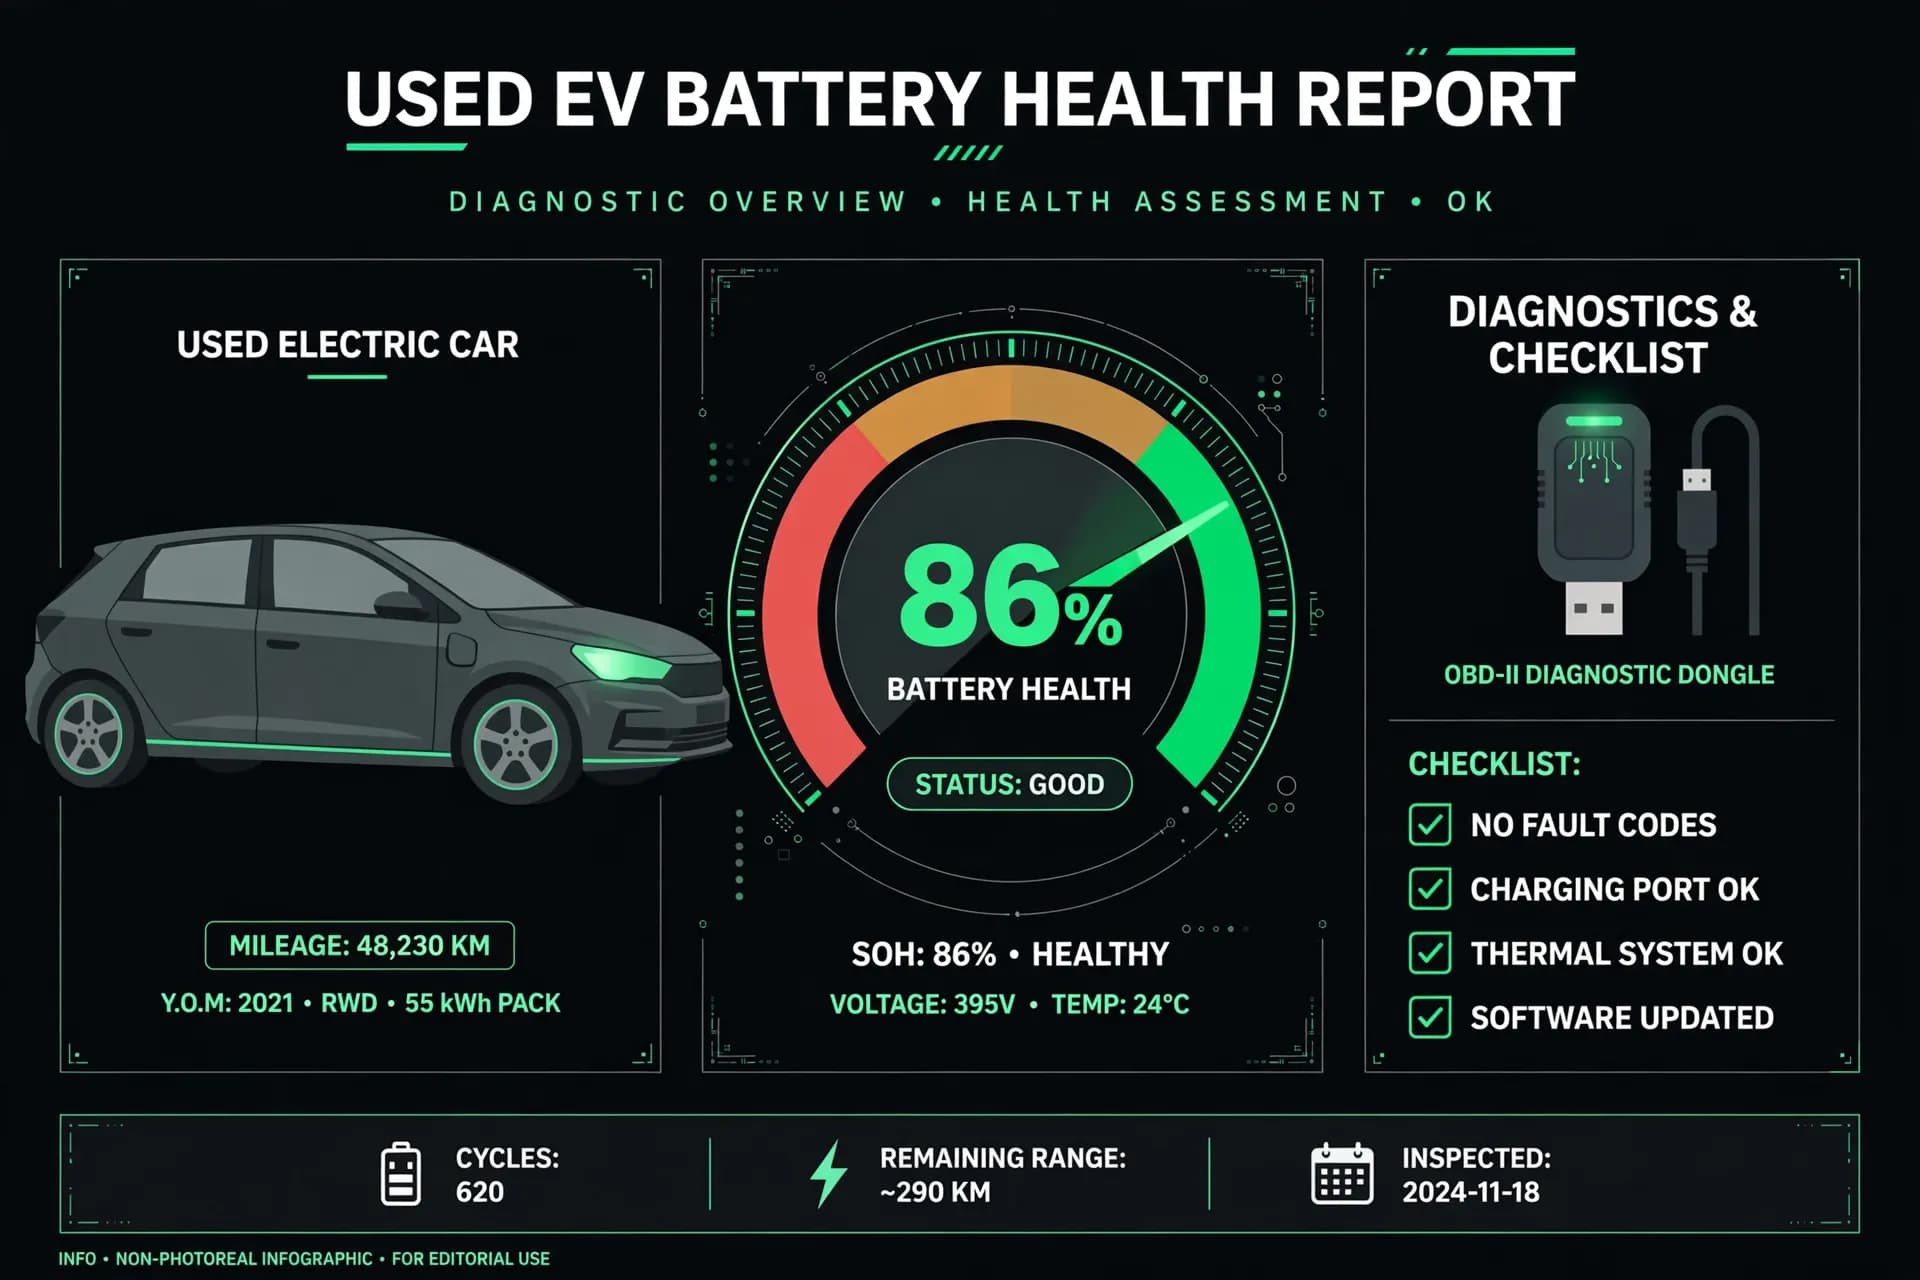
A LeafSpy battery check uses an OBD-II dongle and the LeafSpy app to read the pack SoH directly. Plug the dongle into the diagnostic port, connect the app, and record the SoH percentage, the odometer reading, and the date. Take a photo or screenshot of the reading, so the figure can be compared with the asking price and with other cars inspected.
Cross-check the scan against the dashboard 12-bar gauge. A large disagreement between the scan and the gauge is a reason to pause and seek a second opinion, since one of the two readings may reflect a recent reset, a replaced component, or a gauge that has not yet caught up with pack condition. Also ask how the car was charged: frequent high-power fast charging, long periods at full charge in heat, and heavy use in hot climates all point toward faster degradation in the Geotab data.
What 85% SoH means for a 300-mile car
The worked range math is simple, and it should set the price. A car rated at 300 miles when new delivers about 255 miles at 85 percent SoH, from 300 multiplied by 0.85. Cold weather, highway speeds, and battery age will reduce usable range further, so a buyer should test the car against the longest regular trip, with a margin, rather than against the headline rating.
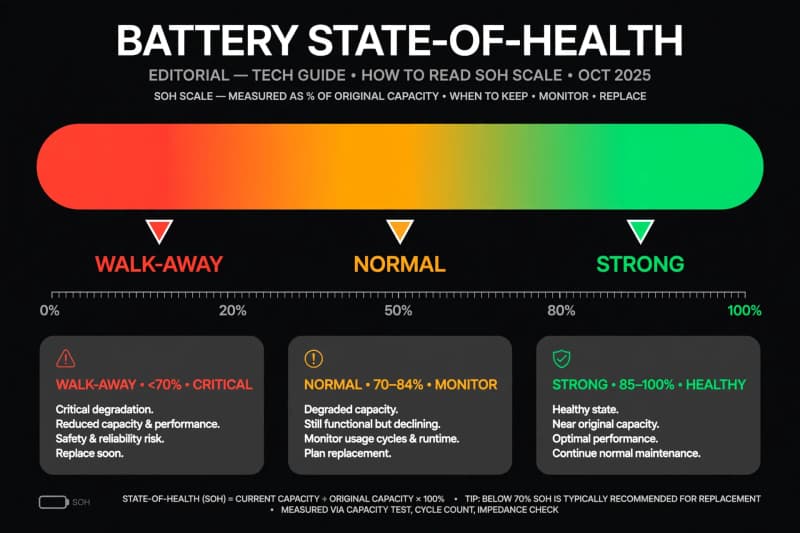
For anyone buying a used electric car, battery health is the price-setting factor, since range loss cannot be restored with servicing. The bands below are Joule Post guidance derived from the 70 percent warranty floor and the Geotab degradation curve. Compare the EV battery state of health with the car’s age and mileage: a low reading on a young car is a stronger warning than the same reading on an older car with high mileage.
| SoH band | Joule Post guidance |
|---|---|
| 90 percent and above | Strong, pay close to market value if other checks pass |
| 80 to 89 percent | Normal for age, price should reflect reduced range |
| Below 80 percent | Negotiate hard, range loss is material |
| Below 70 percent | Warranty territory, walk away unless priced accordingly |
A SoH result should also shape the purchase decision about timing. A car with a healthy pack at a fair price can be a better buy than a newer car with a degraded pack at a similar price. See whether to buy an EV now or wait for solid-state batteries for the wider timing question, but do not let future battery technology distract from the pack in front of you.
Red flags that should stop a purchase
Stop and reconsider when SoH sits below 70 percent without a price that reflects that loss, when the scan reading and dashboard gauge disagree sharply, or when recall work shown by a VIN check remains incomplete. A seller who refuses a scan, refuses a VIN check, or cannot explain the charging history is also a warning sign. So is a Leaf bought for regular long-distance fast charging, given the orphaned CHAdeMO port and Rapidgate throttling on 2018 and later cars.
A final practical test helps: drive the car on a familiar route, note the battery percentage used, and compare that consumption with the SoH reading and the rated range. A large gap between expected and observed consumption deserves investigation before money changes hands.
Frequently asked questions
How do I judge the battery health of a used Leaf?
Read SoH with LeafSpy and an OBD-II dongle, cross-check the 12-bar dashboard gauge, and compare the result with the car’s age and pack size. Pay special attention to 2016 to 2017 cars with the 30 kWh pack, check heat and fast-charging history, and verify recalls by VIN. Recurrent data puts Leaf range at 93 percent of original after 3 years and 91 percent after 5 years, so a reading far below those levels deserves a price reduction or a walk-away decision.
What SoH should I accept on a used EV?
Accept 90 percent and above as strong, and 80 to 89 percent as normal for age, with price adjusted for range loss. Below 80 percent, negotiate hard. Below 70 percent, treat the car as warranty territory and walk away unless the price fully reflects the loss.
Is a LeafSpy scan worth it before buying?
Yes, a LeafSpy battery check is worth it before buying. A dongle and app cost far less than the price difference between a healthy pack and a degraded one, and the SoH reading gives a concrete basis for negotiation. Record the reading with the date and odometer reading, and use it alongside the dashboard gauge and VIN recall check.