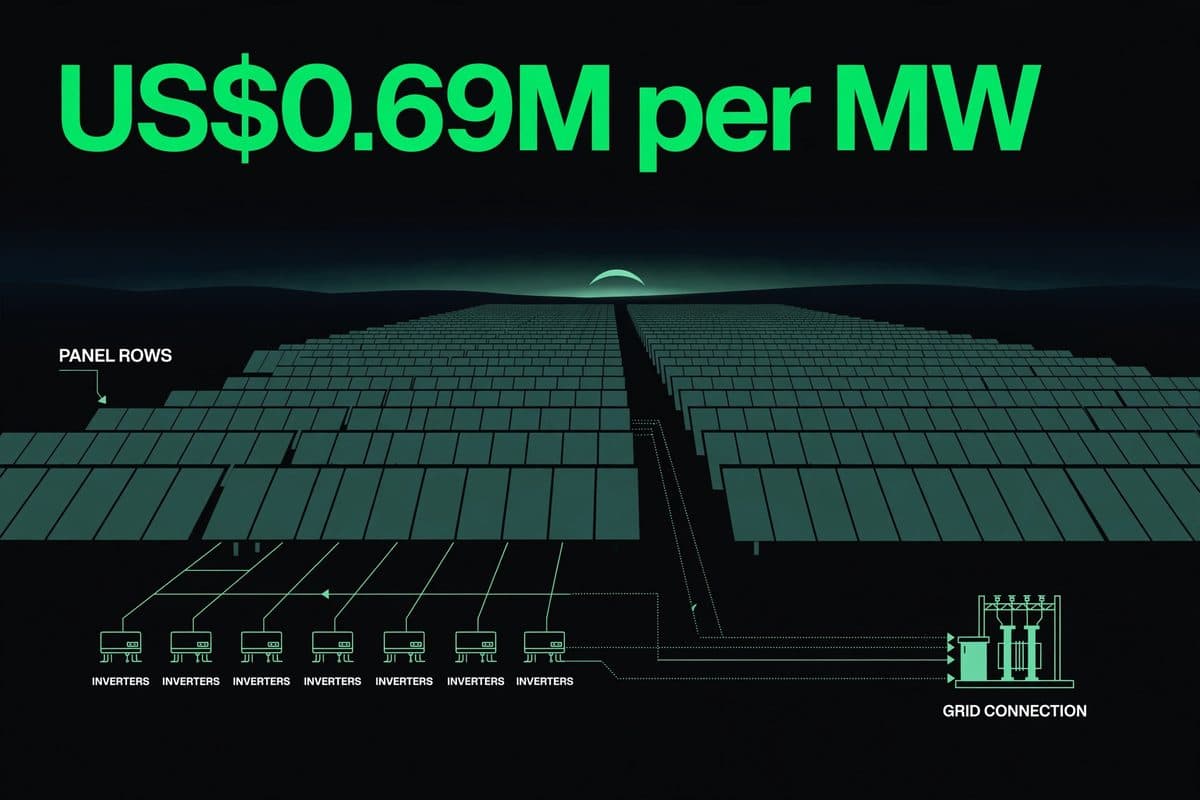
- IRENA puts the 2024 global average at US$691 per kW, or US$0.69 million per MW, down 87% from 2010, while US projects cost substantially more.
- US benchmarks cluster at US$1.07 per watt for solar alone and US$1.71 per watt with four hours of storage, according to the Department of Energy’s 2025 first-quarter figures.
- A 100 MW farm costs roughly US$69 million at the global benchmark and US$107 million to US$171 million at US benchmark rates, before land and grid upgrades.
Utility-scale solar farm cost per MW: the all-in price to design, build and connect one megawatt of large solar capacity, covering panels, inverters, racking, labour, land preparation, grid connection and financing, usually quoted in dollars per watt of DC capacity.
Four buckets decide the final bill behind the utility-scale solar farm cost per MW: modules and inverters, the steel and wiring that hold them up, the grid connection that carries power to customers, and the cost of money itself. Change any one of them and the headline number moves by tens of millions of dollars on a large project. The figures below come from IRENA, the US Department of Energy and Lawrence Berkeley National Laboratory, the three public sources developers and analysts use most, and every comparison in this guide is built from those published numbers.
IRENA’s July 2025 cost report sets the global anchor. Solar PV projects commissioned in 2024 carried a weighted average total installed cost of US$691 per kilowatt, and the electricity they generate averaged US$0.043 per kilowatt-hour, 41% below the cheapest new fossil fuel plant. Solar supplied 452.1 GW of the 582 GW of renewable capacity added worldwide in 2024, close to 78% of the total. The US numbers sit above that global average for reasons that have little to do with the panels themselves.
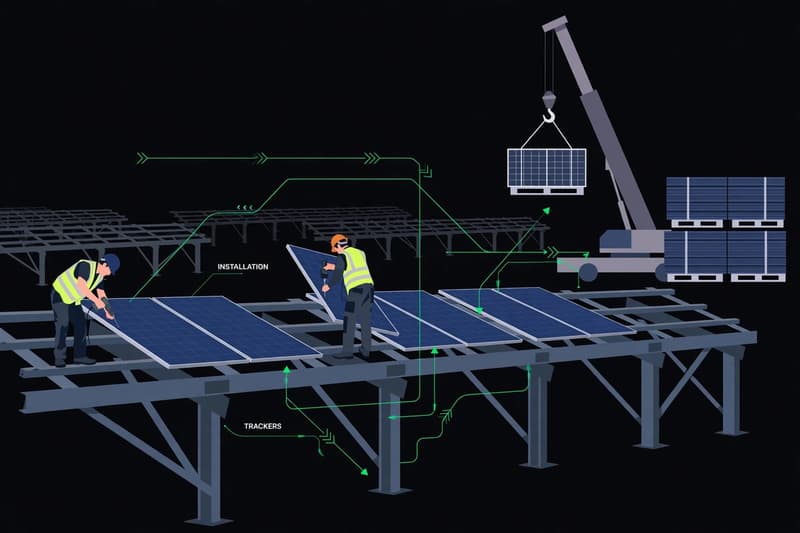
The Global Benchmark for Utility-Scale Solar Farm Cost per MW
The fall in the global figure is one of the steepest cost declines in energy history. IRENA records total installed costs for solar PV at US$5,283 per kW in 2010 and US$691 per kW in 2024, a drop of 87%. The levelised cost of electricity fell further, from US$0.417 per kWh to US$0.043 per kWh over the same period, a decline of about 90%. Solar PV capacity factors improved at the same time, from 15% in 2010 to 17% in 2024, as better panels and tracking mounts squeezed more energy from the same sunlight.
China and India pull the global average down. IRENA reports solar PV levelised costs of US$0.033 per kWh in China and US$0.038 per kWh in India for 2024, both below the US$0.043 global average, reflecting vertically integrated supply chains and large domestic manufacturing capacity. The gap between those markets and the rest of the world is the first thing to understand about any cost per MW figure: it describes where the project is built as much as what is built.
IRENA expects the decline to continue, projecting global total installed costs of about US$388 per kW for solar PV over the next five years. The same report carries a warning that matters for 2026 budgets. Trade tariffs on renewable components and materials, plus shifts in Chinese manufacturing, could raise costs in the short term even as the long-run trend points down. Financing costs are the other variable IRENA singles out: capital costs shaped by revenue certainty, capital structure and macroeconomic conditions decide whether a cheap project on paper stays cheap in practice.
What US Developers Pay per MW
US installed costs run well above the global benchmark. Lawrence Berkeley National Laboratory’s Utility-Scale Solar 2025 edition puts the median installed cost for US projects completed in 2024 at US$1.28 per watt DC in constant 2024 dollars, or US$1.28 million per MW. That figure has barely moved in three years: the same series records US$1.24 per watt in 2021, US$1.27 in 2022 and 2023, and US$1.28 in 2024. Supply chain disruption and interconnection delays flattened a decline that had run almost uninterrupted since 2010, when the median stood at US$5.52 per watt.
The Department of Energy’s cost benchmarks for the first quarter of 2025 break the US figure into two cases for a 100 MWdc plant. Solar alone benchmarks at US$1.07 per watt DC on a minimum sustainable price basis, or US$1.12 per watt on a modelled market price basis, with operations and maintenance at US$20 per kWdc per year. Add 240 MWh of battery storage and the benchmark rises to US$1.71 per watt DC, with operations and maintenance at US$33 per kWdc per year. The benchmarks are stated in 2024 US dollars and exclude subsidies, which reduce the owner’s effective cost. Storage, in other words, adds about US$0.64 per watt DC to the build, a premium worth pricing separately from the panels.
Mounting choice moves the number too. Single-axis tracking is now the dominant mount type: 96% of all new US utility-scale capacity added in 2023 uses it, according to Lawrence Berkeley National Laboratory’s 2024 edition. Trackers cost more than fixed tilt in steel and motors, and they earn it back in extra energy across the day, which is why developers keep choosing them. Bifacial panels, which collect light from both faces, are often paired with trackers on the same projects.
Where the Money Goes Inside a Solar Farm
A cost per MW figure bundles five kinds of spending. Modules and inverters are the largest single hardware line, and module prices have fallen furthest, which is why the global average dropped 87% since 2010. Balance of system covers racking, wiring, combiner boxes and foundations. Civil works cover grading, roads and fencing. The grid connection covers the substation, transformers and the transmission line to the nearest network point, and it varies more by site than any other line: a plant next to an existing substation pays a fraction of what a remote site pays. Soft costs cover permitting, engineering, financing fees and the developer’s margin. How solar panels convert sunlight into electricity sets the technical baseline for what all that hardware does.
The table below puts the published benchmarks side by side. Read the capacity basis column with the figures: IRENA states its capacity on an AC basis, while the US figures are per watt DC, so the two sets describe slightly different denominators and the US premium is a little larger than a direct subtraction suggests.
| Benchmark | Cost per MW | Capacity basis | What it covers | Year and source |
|---|---|---|---|---|
| IRENA global average, solar PV | US$0.69 million | AC | Full installed cost, all project types | 2024 commissions, IRENA |
| DOE/NREL benchmark, solar only, 100 MWdc | US$1.07 million | DC | Modules, inverters, racking, install, no storage | 2025 Q1, US DOE |
| LBNL median, US projects | US$1.28 million | DC | Full installed cost, measured projects | 2024, LBNL Utility-Scale Solar 2025 |
| DOE/NREL benchmark, solar plus 240 MWh storage | US$1.71 million | DC | Solar plus four-hour battery storage | 2025 Q1, US DOE |
| Terra-Gen Lockhart, implied | US$1.76 million | Combined solar plus storage MW | US$950 million for 365 MW solar and 173.7 MW storage | 2026, Joule Post arithmetic |
| DOE/NREL benchmark, residential rooftop, 8 kWdc | US$2.78 million | DC | Small rooftop system, solar only | 2025 Q1, US DOE |
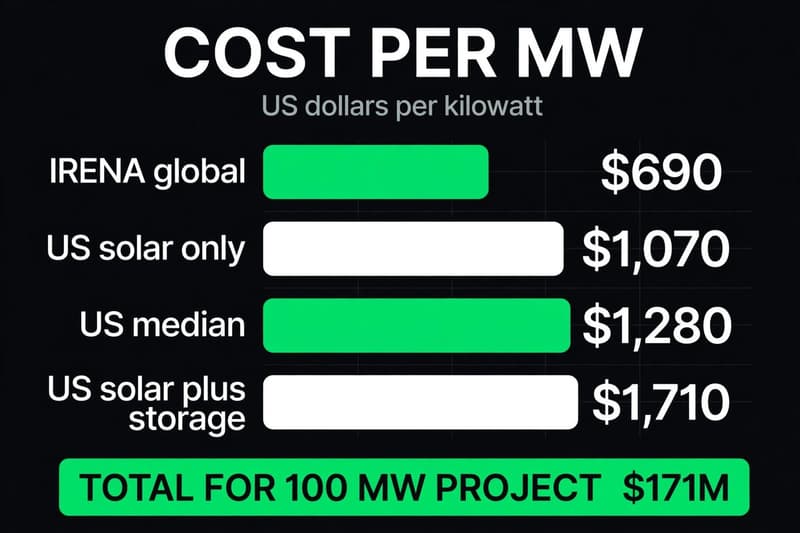
What US$691 per kW Means for a 100 MW Project
Multiply the benchmarks by 100 and the range a developer faces becomes concrete. At the IRENA global average of US$0.69 million per MW, a 100 MW farm costs about US$69 million. At the DOE solar-only benchmark of US$1.07 million per MW, the same capacity costs about US$107 million. At the LBNL US median of US$1.28 million per MW, it costs about US$128 million. At the DOE solar-plus-storage benchmark of US$1.71 million per MW, it costs about US$171 million. The spread between the global average and the US solar-plus-storage figure is about US$102 million on a single 100 MW project, and that spread is the practical meaning of the cost per MW debate. (All four totals are Joule Post arithmetic from the published benchmarks above.)
Storage explains most of the gap between the low and high ends. Storage adds about US$0.64 per watt DC on the DOE benchmarks, which works out to about US$64 million on a 100 MWdc project paired with 240 MWh of batteries. A buyer who quotes a single cost per MW without saying whether storage is included is quoting a number that can move by US$64 million on a 100 MW deal before land or grid work enters the picture.
Operating costs deserve the same treatment. The DOE benchmark puts operations and maintenance at US$20 per kWdc per year for solar alone, or about US$2.0 million a year on a 100 MWdc plant, rising to US$33 per kWdc per year with storage. Over a 25-year operating life those annual figures add up to roughly half the build cost again, which is why developers compare projects on levelised cost of electricity, currently US$0.043 per kWh globally per IRENA, rather than on build cost alone.
Land is the cost the per MW figure hides most completely. NREL’s land-use survey of US plants found a 100 MWac plant needs hundreds of acres of direct land, with tracking plants needing more than fixed-tilt ones, and the price of that land, plus the cost of the grid connection, can exceed the storage premium several times over on expensive sites.
A Real Project Priced Against the Benchmarks
Announced project figures give the benchmarks a reality check. Terra-Gen’s Lockhart project in Texas, reported by Joule Post, carries a US$950 million price tag for 365 MW of solar paired with 173.7 MW of storage. Dividing the announced figure by the combined 538.7 MW of capacity gives an implied US$1.76 million per MW. (Joule Post arithmetic; the division blends solar and storage megawatts, so it is a rough cross-check rather than a like-for-like benchmark.)
The Lockhart figure lands just above the DOE solar-plus-storage benchmark of US$1.71 million per MW, which is where a large hybrid project should sit. The premium over the solar-only benchmarks reflects the batteries, the Texas grid connection and the scale of the build rather than any anomaly in pricing. Read the other way, the comparison validates the benchmarks: a real US$950 million deal prices about 3% above the published solar-plus-storage figure. Terra-Gen’s US$950 million Lockhart solar and storage project shows how the arithmetic works on a live deal.
Rooftop Solar Costs 2.6 Times More per Watt
Scale is the cheapest cost cutter in solar. The DOE benchmark for an 8 kWdc residential rooftop system in the first quarter of 2025 is US$2.78 per watt DC, against US$1.07 per watt DC for a 100 MWdc utility plant. Dividing the two figures gives a ratio of about 2.6: a homeowner pays roughly 2.6 times more per watt than a utility developer for the same sunlight. (Joule Post arithmetic from the DOE benchmarks.) The gap comes from fixed costs spread over fewer watts: design, permitting, sales and a crew’s day on site cost nearly as much for 8 kW as for a share of a 100 MW build.
That ratio is the reason community solar and utility-scale procurement dominate US deployment even as rooftop systems keep growing. A landowner weighing a lease offer, or a town weighing a community solar subscription, is effectively buying into the US$1.07 per watt cost structure rather than the US$2.78 rooftop structure, and the difference flows straight into the price of the electricity. How many solar panels a home needs works through the rooftop side of the same maths.
Frequently asked questions
How much money does a solar field cost?
A 100 MW solar field costs about US$69 million at the IRENA global average of US$0.69 million per MW, and about US$107 million to US$171 million at US benchmark rates depending on whether batteries are included. Land, grid connection and financing sit on top of those build costs.
How much does a 1 MW solar farm cost?
About US$0.69 million at the 2024 global average, about US$1.07 million for solar alone at US benchmark rates, and about US$1.71 million with four hours of battery storage. A 1 MW build would price above the 100 MW benchmarks, since fixed costs spread over fewer watts.
What is the cheapest way to build a solar farm?
Fixed-tilt mounts on flat land near an existing substation, in a market with low labour costs and established supply chains, produce the lowest cost per MW. Trackers cost more than fixed tilt in steel and motors, but they capture more energy across the day, so they often produce cheaper electricity per MWh despite the higher build cost.
Does adding batteries double the cost of a solar farm?
No. On the DOE’s 2025 first-quarter benchmarks, adding 240 MWh of storage to a 100 MWdc solar plant lifts the cost from US$1.07 per watt DC to US$1.71 per watt DC, an increase of about 60%. Battery pack costs have fallen 93% since 2010, to US$192 per kWh in 2024 per IRENA, which is why storage pairing has become standard on new US projects.
Why do US solar farms cost more than the global average?
Higher labour and permitting costs, longer interconnection queues, and tariffs on imported components push US installed costs above the global average, while China and India pull the average down with integrated supply chains. The LBNL median of US$1.28 per watt DC for 2024 is about 85% above the IRENA global average of US$0.69 per watt, and the gap has persisted for three years.
Sources
- IRENA, Renewable Power Generation Costs in 2024, July 2025
- US Department of Energy, Solar Photovoltaic System Cost Benchmarks, 2025 Q1 benchmarks, updated September 2, 2026
- Lawrence Berkeley National Laboratory, Utility-Scale Solar, 2025 Edition, 2025
- Lawrence Berkeley National Laboratory, Utility-Scale Solar, 2024 Edition, October 2024
- NREL, Land-Use Requirements for Solar Power Plants in the United States (Ong et al.), June 2013
- Joule Post, Terra-Gen Lockhart solar and storage project, November 2026