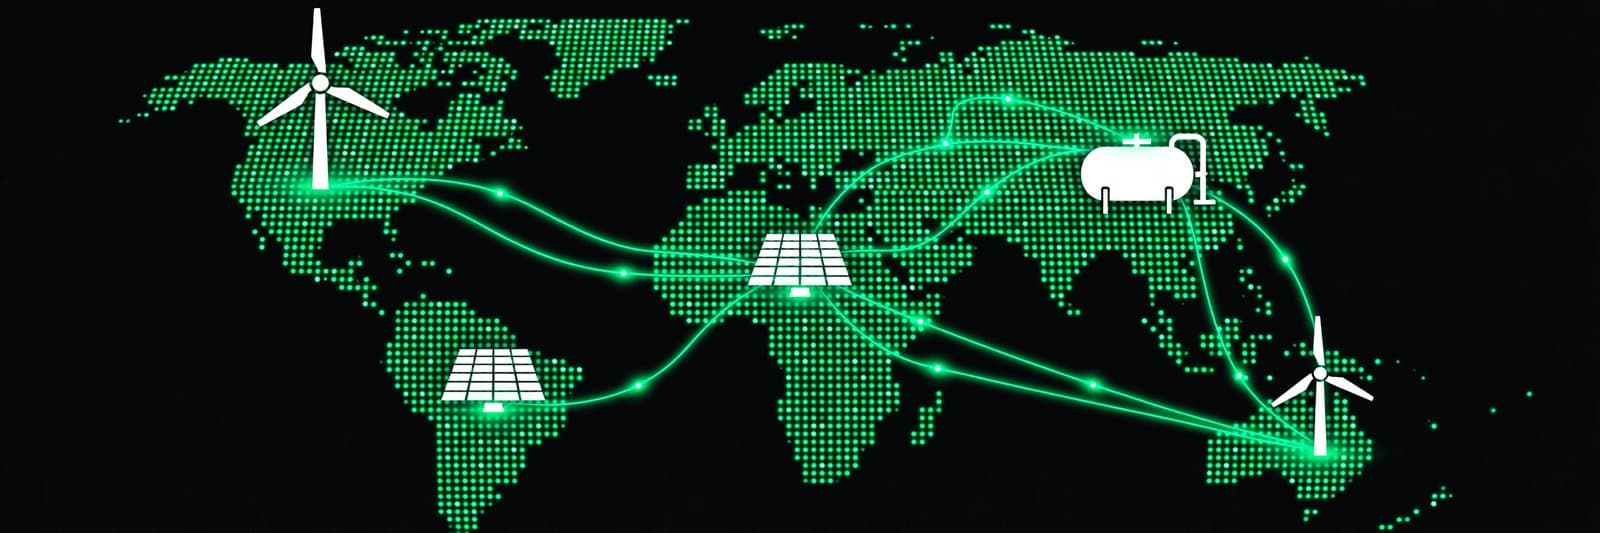
- China has the cheapest green hydrogen in 2026, with direct-connected projects producing at CNY 16 to CNY 19 per kg, about US$2.25 to US$2.68 per kg at CNY 7.1 per US$1.
- India discovered a real auction price of ₹397 per kg, about US$4.60 per kg, for 25 years of supply to Indian Oil, while Japan faces the highest modelled import costs at more than US$10 per kg without Chinese supply.
- Most country figures are modelled averages or single auctions, so the table below labels every number by type before comparing them.
Green hydrogen price per kg: the cost of producing one kilogram of hydrogen by splitting water with renewable electricity, usually quoted as a levelised cost that folds power, equipment, financing and operation over the life of a plant into a single per-kilogram figure.
Three different kinds of numbers sit behind every country comparison of green hydrogen, and mixing them up produces nonsense. An auction price is a signed commitment to deliver at a fixed rate for decades. A long-term contract price is a negotiated rate between two parties. A modelled average is a calculation built from assumed power prices, equipment costs and financing rates. The table keeps those three kinds separate, because a buyer who treats a model as a market price will budget for hydrogen that no supplier will sell.
That distinction shapes the whole ranking. China leads on production cost because its cheapest projects connect electrolysers directly to large wind and solar bases, skipping the premium on industrial electricity tariffs. India sits in the middle on a genuine auction result. The United States, Germany and Japan look expensive in the EWI model because the model averages whole-country supply, including transport, rather than pricing the best site in each country.
- Green hydrogen price per kg by country in 2026
- How to read the table
- China sets the floor for green hydrogen cost
- India and the auction price that reset expectations
- Chile, Australia and the resource advantage
- The United States, Europe and Japan pay for power and distance
- South Africa and the cost of capital problem
- What a US$5.24 per kg gap means for green hydrogen buyers
- Frequently asked questions
Green hydrogen price per kg by country in 2026
The table below gathers the best available figure for each country, with the year and the type of figure stated in every row. Figures in local currency stay in that currency, with a US dollar conversion shown only where the source itself gives one or where the conversion is labelled as a Joule Post calculation. The cheapest green hydrogen country in this table is China, on direct-connected production costs reported by Shanghai Metals Market in September 2026.
| Country | Green hydrogen price | What the figure is | Year | Source |
|---|---|---|---|---|
| China | CNY 16 to CNY 19 per kg, about US$2.25 to US$2.68 per kg | Direct-connected production cost at wind and solar bases | 2026 | Shanghai Metals Market |
| India | ₹397 per kg, about US$4.60 per kg | Auction price, 25-year supply to Indian Oil Panipat refinery | 2025 | JMK Research |
| Chile | €2.0 to €3.0 per kg | Modelled levelised cost in optimised high-resource regions | 2025 | Energies peer-reviewed review |
| Australia | US$3.38 per kg | Modelled levelised cost, Pilbara off-grid system | 2026 | Renewable Energy journal |
| United States | US$7.49 per kg | Modelled average supply cost, EWI Global PtX Cost Tool | 2026 | Institute of Energy Economics, University of Cologne |
| Germany (EU proxy) | US$5.83 per kg | Modelled average supply cost, EWI Global PtX Cost Tool | 2026 | Institute of Energy Economics, University of Cologne |
| Japan | US$6.33 per kg with imports from China; more than US$10 per kg without them | Modelled average supply cost, EWI Global PtX Cost Tool | 2026 | Institute of Energy Economics, University of Cologne |
| South Africa | €5.0 to €6.5 per kg | Modelled levelised cost, mid-range for Sub-Saharan Africa | 2025 | Energies peer-reviewed review |
Two rows in the table carry a Joule Post conversion. The EWI figures arrive in US dollars per megawatt-hour, so the US dollar per kilogram figures for the United States, Germany and Japan come from dividing by 33.3 kilowatt-hours per kilogram, the lower heating value of hydrogen. The China conversion uses CNY 7.1 per US$1. Both conversions are arithmetic done by Joule Post, and the original figures stay visible in the text so a reader can repeat the maths.
How to read the table
A single global price for green hydrogen does not exist, and any source that quotes a hydrogen price per kg 2026 figure without naming the country is hiding the interesting part. The International Energy Agency put the point plainly in its Global Hydrogen Review 2025, published 12 September 2025: the cost of low-emissions hydrogen varies sharply by location, and China can produce green hydrogen at a cost 40 to 45 percent lower than Europe or the United States, thanks to lower cost of capital, cheaper renewable electricity and faster permitting. The same review recorded hydrogen demand of nearly 100 million tonnes in 2024, with less than 1 percent of it classed as low-emissions, and electrolyser-based production growing 60 percent year on year in 2024.
The cheapest green hydrogen country label belongs to the best site rather than the national average. China holds 60 percent of global electrolyser manufacturing capacity, at 4.9 gigawatts against 0.6 gigawatts in 2021, according to the same IEA review. That manufacturing scale feeds directly into project costs, since equipment is one of the two large items in the cost stack alongside electricity. A peer-reviewed review in Energies, published 22 September 2025, puts alkaline electrolyser investment at €500 to €800 per kilowatt and PEM systems at €1,000 to €1,500 per kilowatt, with the gap driven by iridium and platinum catalysts in PEM stacks.
Electricity dominates the running cost. The same Energies review notes that conventional electrolysis uses 9 to 12 litres of deionised water per kilogram of hydrogen, a small cost beside power. Readers who want the full global range behind this country table can start with our earlier guide to green hydrogen cost per kg in 2026, which sets the unsubsidised global range at US$2.50 to US$7.00 per kg. The colour labels in that guide, grey, blue and green, describe how the hydrogen is made, and our grey, blue and green hydrogen explainer covers what each label means for emissions.
China sets the floor for green hydrogen cost
China is the cheapest green hydrogen country in 2026 because its cost structure splits into clear layers, and the cheapest layer is now close to grey hydrogen. Shanghai Metals Market reported on 8 September 2026 that coal-based grey hydrogen in China costs CNY 13 to CNY 15 per kg, with a benchmark near CNY 14 per kg at a coal price of CNY 950 per metric ton. All figures in this paragraph are Chinese yuan, the currency of China. Natural gas-based hydrogen costs CNY 16 to CNY 18 per kg, and blue hydrogen with carbon capture costs CNY 18 to CNY 22 per kg in 2026.
Direct-connected green hydrogen, where electrolysers draw power straight from large wind and solar bases, costs CNY 16 to CNY 19 per kg, according to the same SMM report. That range overlaps the gas-based grey range and sits just above the coal-based benchmark. Green hydrogen made with industrial and commercial electricity tariffs costs far more, at CNY 24 to CNY 26 per kg, because the tariff adds a premium that direct connection avoids. Long-term contracts for 10,000-tonne green hydrogen volumes settled at CNY 19 to CNY 22 per kg in 2026, close to the ex-factory price of grey hydrogen in eastern China.
The gap to full parity is now small enough to measure in single yuan. SMM calculates that green hydrogen reaches comprehensive parity with coal-based grey hydrogen when its levelised cost falls to CNY 14 per kg or below, and it lists four conditions for that to happen: power at CNY 0.15 per kilowatt-hour or less, electrolyser utilisation above 5,000 hours a year, electrolyser system prices below CNY 1,200 per kilowatt, and electricity consumption within 4.6 kilowatt-hours per normal cubic metre. Each missing condition adds CNY 1.5 to CNY 3 per kg. Carbon pricing helps close the gap from the other side, since coal-based hydrogen emits about 20 kilograms of carbon dioxide per kilogram of hydrogen, and a carbon price of CNY 100 per metric ton adds about CNY 2 per kg to grey hydrogen.
The IEA expects the Chinese advantage to widen by 2030. Its Global Hydrogen Review 2026, summarised by the Green Hydrogen Organisation after its launch in June 2026, projects that the cheapest green hydrogen by 2030 will come from northern China, where optimised combinations of solar and wind can bring production costs below US$2 per kg. Some locations in Europe could fall to US$3.50 per kg by 2030, while the Middle East, India and Chile could reach just above US$3 per kg. The same review recorded low-emissions hydrogen production growing 20 percent in 2025 to almost 1 million tonnes.
India and the auction price that reset expectations
India supplied the most useful number in this table because it came from a competitive auction rather than a model. Indian Oil Corporation concluded its first green hydrogen end-user offtake auction in May 2025, and JMK Research reported the result on 20 May 2025: a price of ₹397 per kg, about US$4.60 per kg, for 10,000 metric tonnes a year supplied to the Panipat refinery for 25 years under a build-own-operate arrangement, with L&T Energy GreenTech as the winning bidder. All figures in this paragraph are Indian rupees unless a US dollar equivalent is stated. JMK notes that the discovered price sits about 27 percent below the global average cost of producing green hydrogen, and that future tenders could fall to ₹350 to ₹360 per kg as scale grows and incentives apply.
The auction matters because it is a price a supplier agreed to honour, with a named buyer, a named plant and a 25-year term. Models can assume cheap power and high utilisation; an auction tests whether a developer will sign a contract at the quoted figure. Indian Oil plans to shift half of its hydrogen demand to green sources by 2030, targeting cumulative capacity of 350,000 metric tonnes a year, according to JMK, which gives the Panipat price a pipeline of follow-on demand behind it.
India still pays a premium over grey hydrogen. JMK puts the average cost of conventional grey hydrogen at about US$2.10 per kg, so the Panipat green price carries a premium of about US$2.50 per kg over grey, or roughly 2.2 times the grey price. That premium is the number Indian refiners and fertiliser makers must justify, and it is smaller than the premium in most Western markets. The green hydrogen cost China India comparison runs through this whole table: China wins on production cost, India wins on price transparency, and a buyer choosing between the two is choosing between a modelled Chinese floor and a signed Indian contract.
Chile, Australia and the resource advantage
Chile and Australia share the same advantage, exceptional sun and wind, and the same problem, distance from the buyers who would pay for their hydrogen. The Energies review published 22 September 2025 puts optimised high-resource regions such as Chile and Morocco at €2.0 to €3.0 per kg, among the lowest modelled costs anywhere, thanks to strong solar and wind resources. The IEA Global Hydrogen Review 2026 reaches a similar conclusion for 2030, projecting that Chile could reach just above US$3 per kg. Chile has no auction price as firm as the Indian result, so its figure stays a modelled range, but two independent sources now point to the same band.
Australia has a site-level model rather than a national average. A study in Renewable Energy, volume 256, 2026, modelled off-grid green hydrogen across twelve Australian regions with a standard hybrid system of 60 percent solar photovoltaics, 40 percent wind, battery storage, electrolysers and hydrogen tanks. The Pilbara region recorded the lowest levelised cost at US$3.38 per kg, with a 9.29 percent internal rate of return. Sensitivity analysis in the study found solar capacity factor and electrolyser capital cost to be the most influential drivers, which matches the pattern in every other country in this table: the resource sets the floor, and the equipment and financing set how close a project gets to it.
Australia also illustrates why a low production cost does not guarantee an export business. The same study notes that countries such as Chile and Saudi Arabia may reach levelised costs below US$2 per kg by 2030, yet Australian projects must still pay for conversion, shipping and reconversion before their hydrogen reaches a buyer in Japan or Europe. The IEA made the same warning in its 2025 review: 22 million tonnes of announced low-emissions production could miss any chance of operating by 2030 if investment decisions are not taken by early 2027, with two-thirds of that volume sitting in Europe, North America and Latin America. Cheap production without a signed offtake agreement stays on paper.
The United States, Europe and Japan pay for power and distance
The United States looks expensive in the EWI model, and the reason is the average the model builds. The Institute of Energy Economics at the University of Cologne published its updated Global PtX Cost Tool case study on 16 October 2026, comparing supply costs for China, Germany, Japan and the United States. Average green hydrogen supply costs came to US$120 per megawatt-hour for China, US$175 per megawatt-hour for Germany, US$190 per megawatt-hour for Japan with imports from China, and US$225 per megawatt-hour for the United States. Converting those figures at 33.3 kilowatt-hours per kilogram gives about US$4.00 per kg for China, US$5.83 per kg for Germany, US$6.33 per kg for Japan and US$7.49 per kg for the United States. The EWI figures are modelled averages for whole-country supply, including transport, and they should not be read as the price of the best project in each country.
| Country | EWI average supply cost | Joule Post conversion to US$ per kg |
|---|---|---|
| China | US$120 per MWh | About US$4.00 per kg |
| Germany | US$175 per MWh | About US$5.83 per kg |
| Japan, with imports from China | US$190 per MWh | About US$6.33 per kg |
| United States | US$225 per MWh | About US$7.49 per kg |
| Japan, without imports from China | More than US$300 per MWh | More than US$10 per kg |
Policy narrows the American gap, but only for projects that qualify. The United States offers a production tax credit of up to US$3 per kg for clean hydrogen under section 45V of the Inflation Reduction Act, a figure confirmed in the Bruegel analysis of the European Hydrogen Bank auction. Subtracting the full US$3 per kg from the modelled US$7.49 per kg average leaves about US$4.49 per kg, still above the Indian auction price and far above the Chinese floor. The credit is tiered by lifecycle emissions intensity, so a project only receives the maximum rate when its hydrogen is genuinely low-carbon, and the choice of electrolyser technology affects both the cost and the emissions profile. Our PEM versus alkaline electrolyser comparison covers the trade-off between flexibility and capital cost that sits behind that choice.
Europe shows the same pattern in subsidy form. The European Hydrogen Bank ran its first auction, which closed on 30 April 2024, allocating €720 million to seven renewable hydrogen projects. Winning bids for the subsidy ranged from €0.37 to €0.48 per kg, with an average of €0.40 per kg, against a ceiling of €4.50 per kg. Bruegel, analysing the results, calculated that producing renewable hydrogen in Europe costs €4 to €6 per kg more than fossil-based hydrogen, so the small subsidy bids mean buyers are paying most of the premium themselves. The winning projects clustered in Spain, Portugal, Norway and Finland, where renewable electricity is cheapest, which is the same resource logic that makes Chile and the Pilbara cheap.
Japan has the hardest arithmetic in the table. The EWI case study found that Japan has only small and expensive domestic production potential, and as an island nation without pipeline links to the mainland it can only import hydrogen by ship. Seaborne transport adds about US$80 per megawatt-hour, which converts to about US$2.66 per kg on the same 33.3 kilowatt-hour basis. Even with that shipping premium, imports from China at about US$190 per megawatt-hour, or about US$6.33 per kg, beat domestic Japanese production. Without imports from China, Japanese import costs rise above US$300 per megawatt-hour, or more than US$10 per kg. Japan is the clearest case in this table of a country where the delivered price, rather than the production cost, decides whether green hydrogen gets used.
South Africa and the cost of capital problem
South Africa shows what happens when the resource is strong but the financing is expensive. The Energies review published 22 September 2025 puts South Africa, Niger and Kenya in a mid-range band of €5.0 to €6.5 per kg, against a Sub-Saharan African range of €5.0 to €7.7 per kg. South Africa has a detailed Hydrogen Society Roadmap, platinum reserves for PEM electrolysers, and more than 150,000 megawatts of hydrogen-related capacity in development, according to the same review. The resource is there, and the industrial base is there, but the cost of capital in emerging economies can reach about three times advanced-economy levels, a point the IEA has made repeatedly, and that financing gap lands directly in the per-kilogram price.
Water adds a second constraint that rarely appears in price headlines. Conventional electrolysis uses 9 to 12 litres of deionised water per kilogram of hydrogen, according to the Energies review, and desalination or direct seawater electrolysis adds US$0.05 to US$0.07 per kg. That adder is small beside a €5 per kg levelised cost, but it matters for site selection in the Northern Cape, where solar resources are strong and water is scarce. For readers tracking how hydrogen moves once it is made, our guide to how hydrogen is stored and transported covers compression, liquefaction and chemical carriers, and our green ammonia explainer covers the carrier most export projects actually plan to ship.
What a US$5.24 per kg gap means for green hydrogen buyers
The spread inside this table is the story. Taking the cheapest production figure, China at about US$2.25 per kg, and the most expensive modelled average, the United States at about US$7.49 per kg, the gap is US$5.24 per kg, and the American figure is 3.3 times the Chinese one. That is a Joule Post calculation from the two figures in the table; no source quotes the US$5.24 figure itself. A refiner buying 10,000 tonnes a year, the same volume as the Panipat contract, would pay about US$52.4 million more per year at the American average than at the Chinese floor, before transport. The arithmetic is simple: 10,000 tonnes equals 10 million kilograms, and 10 million multiplied by US$5.24 equals US$52.4 million.
Three conclusions follow from that gap. First, location decides the price more than technology does. The electrolyser in a cheap project and the electrolyser in an expensive project are often the same machine; the difference is the power price, the utilisation hours and the financing rate. Second, subsidies change the ranking but do not erase it. The full United States tax credit of US$3 per kg would cut the modelled American average to about US$4.49 per kg, still roughly double the Chinese floor. Third, trade does not automatically fix the gap. Japan pays about US$2.66 per kg in shipping costs alone on EWI figures, which consumes more than half of the saving from buying Chinese hydrogen instead of making its own.
Buyers should therefore treat the cheapest figure in each country as a starting point for diligence, and check it against a signed contract before budgeting. Ask whether the number is an auction result, a contract or a model. Ask what power price and utilisation rate sit behind it. Ask whether transport, conversion and reconversion are included. The Panipat auction passes those tests because the price, the volume, the term and the buyer are all public. The EWI averages pass a different test: they show what a whole country must pay on average, which is the right question for a policymaker planning national supply, even though it is the wrong number for a buyer pricing a single project.
Frequently asked questions
Which country has the cheapest green hydrogen?
China has the cheapest green hydrogen in 2026, with direct-connected projects at wind and solar bases producing at CNY 16 to CNY 19 per kg, about US$2.25 to US$2.68 per kg. The IEA also projects northern China will have the cheapest green hydrogen by 2030, below US$2 per kg.
How does green hydrogen cost in India compare with China?
India discovered US$4.60 per kg, or ₹397 per kg, in a competitive auction for supply to Indian Oil in May 2025, while China reports direct-connected production at about US$2.25 to US$2.68 per kg. The Indian figure is a signed 25-year contract price, while the Chinese figure is a production cost range, so the two are not directly comparable.
What is the green hydrogen price per kg by country in 2026?
It ranges from about US$2.25 per kg in China to about US$7.49 per kg as a modelled average in the United States, with India at US$4.60 per kg on an auction result, Germany at about US$5.83 per kg and Japan at about US$6.33 per kg on modelled averages.
Why is green hydrogen cheaper in China than in Europe?
The IEA attributes the gap to lower cost of capital, cheaper renewable electricity and faster permitting in China, putting Chinese green hydrogen 40 to 45 percent below European and American costs. China also holds 60 percent of global electrolyser manufacturing capacity, which lowers equipment prices.
Will green hydrogen reach US$2 per kg?
The IEA projects northern China could fall below US$2 per kg by 2030, and the Middle East, India and Chile could reach just above US$3 per kg by then. Reaching those levels depends on power at or below CNY 0.15 per kilowatt-hour in China, electrolyser utilisation above 5,000 hours a year, and continued falls in equipment costs.
Sources
- Global Hydrogen Review 2025, International Energy Agency, 12 September 2025
- IEA Global Hydrogen Review 2026: green hydrogen can help prevent the next food and energy crisis, Green Hydrogen Organisation, June 2026
- Green Hydrogen Project Tracker: China hydrogen energy cost stratification becomes clear in 2026, Shanghai Metals Market, 8 September 2026
- IOCL Concludes India First Green H2 End-User Offtake Auction at US$4.6 per kg, JMK Research, 20 May 2025
- Lessons from the European Union inaugural Hydrogen Bank auction, Bruegel, 2024
- EWI tool update: China has a cost advantage in green hydrogen, Sonnenseite, 16 October 2026
- A Review of Green Hydrogen Technologies and Their Role in Enabling Sustainable Energy Access in Remote and Off-Grid Areas Within Sub-Saharan Africa, Energies, 22 September 2025
- Techno-economic and environmental assessment of green hydrogen production in multiple Australian regions using different electrolyzer technologies, Renewable Energy, 2026